Graphic figures catalog
What is a technical analysis for binary options? If briefly – that is the basis of all the basics of binary trading. Analysis of binary…
Graphic shapes are one of the most powerful and intuitive tools to help accurately identify the trend and determine its direction. They are used by both beginners and professionals, graphic shapes able in some cases to completely replace the technical analysis and to run without signals and indicators.
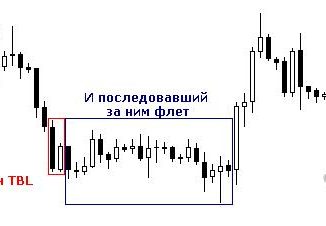
Graphic shapes are divided into 2 types: continuation patterns and reversal patterns. The presence on the chart of trend continuation patterns indicates the period of stagnation in the market. If we are talking about a longer timeframe, complete immobility will persist for a long time. For this reason, some traders in Forex, ignore the figures continue the trend, because trading in the referred period is almost impossible. Players on the binary options more than happy with this figure, since it shows stable and easily predictable movement of the trend.
Reversal patterns indicate a trend reversal and are key for traders, as most successful trades. Built and analyzed such figures also much longer than graphics continue. It is noteworthy that the graphs show the General direction of the price and its trends, while nuances in the digital equivalent, they do not show. For greater precision and clarity traders use in parallel, the overall graphics of the figure and candlestick charts, which display the smallest price fluctuations, and their “shadows” it is possible to assume the exact moment of a trend reversal.
Reversal patterns
As mentioned above, such figures of technical analysis will display the change of trend in the market. All of them are these features:
Such figures often are in the case, if the trend is sustainable and clearly defined.
If the relevant line has been broken the trend line, it is an essential prerequisite for reversal.
The size of the model is crucial. The bigger it is, the more rapid will be the movement.
Technical analysis looks at the change of the downward trend rising such an important indicator as the volume of trade.
If patterns are formed on the bottom, the price movement will be quiet and not Express. The closer to the top – the higher the intensity.
The main feature of any reversal pattern is the presence of a clearly expressed trend. If on the chart there is what looks like a reversal, but the trend is absent in this case, the reversal is actually there (most often), and the signal is false.
Classic graphic shapes
All major reversal patterns and continuation was described by Alexander elder, John j. Murphy, E. Newman, Schwager and others.
To the classic reversal patterns include:
double top and the base;
triple top and the base;
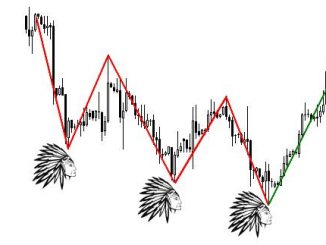
head and shoulders;
the thorn (the base and the V-shaped vertex);
diamond (diamond);
saucer (rounded model).
To the classical trend continuation patterns include:
rectangle;
wedge;
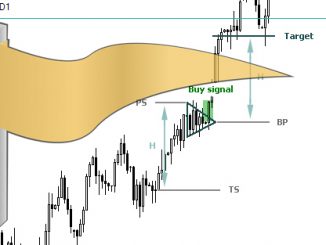
Vympel;
flag;
triangle.
All of these graphic figures can be used both in pure form and in the form of formations on their basis.
Trading tips for beginners
All these figures are effective helpers in trading, but many players are not taught to use them, drain the Deposit. Then, as often happens, the player refuses to use graphic shapes, while they help to significantly improve the work efficiency.
There are typical mistakes traders should keep in mind when working with graphic shapes.
Wishful thinking visible. Eric Naiman, describing the many graphic shapes, mentioned that often fantasy traders draws graphic shapes where they did not. Indeed, inexperienced traders often find no confirmation of this or that graphic, but start to trade because they want there to see.
Evaluation of the figures without regard to timeframe. Before you determine the type of shape you want to view it on different time frames. So, the fifteen-minute interval can be clearly seen spread, on a minute – trend continuation, and hourly or day – of- triangle. And all this on one currency pair. It is necessary to clearly imagine the picture of the market for successful trading. In cases where these shapes are the opposite, you must choose the largest time interval.
Exclusion of other tools. Despite the visibility of graphical shapes, it is desirable to use other trading tools that will make the picture more precise and clear will minimize the likelihood of errors and false signals. It is recommended to use:
— Fibonacci lines;
— Bollinger band;
— inclined channels;
— fundamentals;
— levels of support and resistance;
— track steam-allies;
— Elliott waves etc.
Graphic shapes, especially reversal patterns, allow us to determine not only the movement and direction of prices, but also to determine the price and the best moment to open a position (an important point for trading in the Forex market).
However, no graphical model det not a 100% guarantee that the transaction will be successful. This figure depends on many factors, from the experience of the trader, the chosen strategy of additional tools and signals. In the capable hands of a graphic model will be a great help.