
The analysis of financial markets is a lesson, though very fascinating, but very troublesome. Especially for new traders in the Forex market who still believe in the existence of a perfect trading system, which, in their opinion, will enrich them as soon as possible.

According to beginners, stock market trading technical analysis of financial markets requires a serious theoretical training. In addition, the analysis of financial markets using technical indicators requires a trader a significant amount of time.
Graphical analysis of financial markets looks more convenient, but the Analytics of the currency market, based on the graphic patterns almost always requires additional evidence generated trading signals. Next, is considered one of the most popular models of the graphical analysis pattern ABCD.
The ABCD model
This is one of the simplest figures of graphical analysis. It is designed, and correctly open, in the first half of the XX century by a famous specialist in the field of stock trading – Harold Gartley.
Over the past decades this model has undergone multiple modifications, which, for the most part, touched her inner peace and almost no effect on her appearance.
Harmonic patterns, as well as harmonic analysis in General is not particularly informative without mathematical software, which uses Fibonacci numbers.
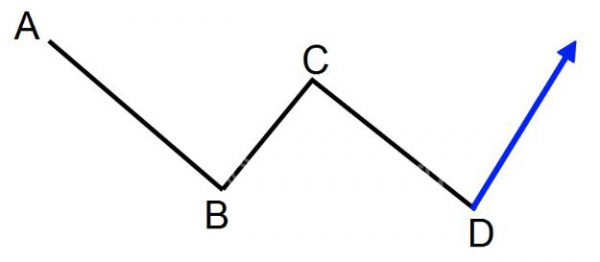
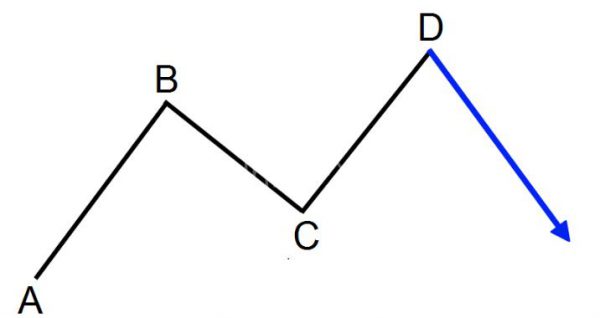
A pattern is formed on the market under the following circumstances – after a pulse average length (segment AB) is a correction (segment BC), after which the continued price movement in the direction of the trend. In the process of formation of the segment CD, the price should break the level D.
The harmony that forms the basis of graphical analysis, expressed by the relation AB=CD. Also essential is the time price chart both segments. It is for these equalities functioning indicator harmonic patterns.
Trading system ABCD
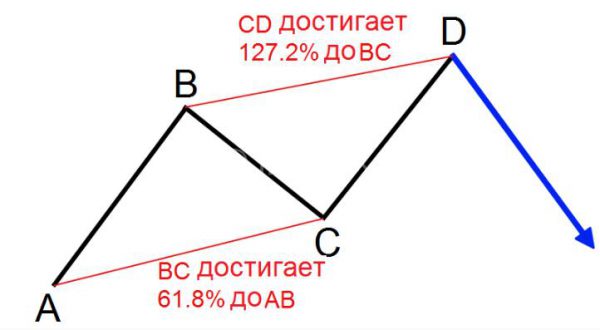
At first glance, everything is simple – you just have to wait for the formation of CD (properly stretched by three points Fibonacci network allows high accuracy to predict point D) and to enter the market. An indicator of pattern ABCD is present in the base configurations all known trading platforms.
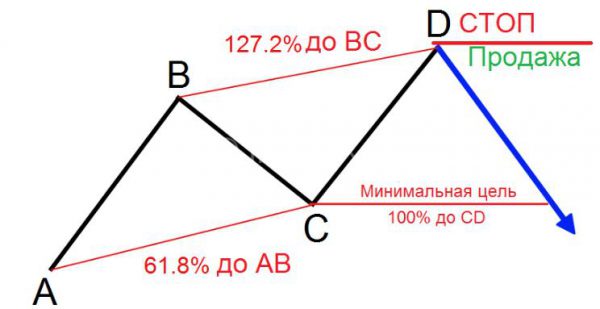
Despite its simplicity, the efficiency of the trading platform on the basis of the pattern ABCD are not very high, but with proper money management and a certain caution, a trader may be able to secure a albeit low, but steady income.
The main reason for the above little efficacy is the fact that harmonic patterns often form false signals.
Oscillatory processes underlying the harmonic shapes are natural to price charts. This creates additional complexity when trading on the patterns in this series.
The main problem of such trading systems is their versatility. The credibility of the Fibonacci numbers, of course, no one doubts, but that mathematical model is not very flexible.
Thus, the indicators developed on the basis of such models, unable to consider the factors uninsurable clear-up digitising. Such factors include the volatility of the trading instrument, the uneven behavior of trading instruments on the various exchanges and some other non-numeric factors.
Conclusion
Summarizing all the above, I would like once again to draw the attention of the trading public on the fact that harmonic analysis does not contain the tools required for detailed and comprehensive analysis of the financial market.
The harmonic model, for all its visual appeal, not (with rare exceptions) to generate trading signals able to provide a profitable trade.