Many of the figures of the trend reversal Forex are based on classical models – patterns Price Action. Along with them, there is a whole class of models, which are defined on the chart on their own – for example, the pattern of high-Speed lines in Forex.

It helps to analyze the development trend in the latter stages, when the movement almost stops. He gives the signal for a turn and if you learn how to apply it in practice, you can get a good opportunity to enter the market at the most advantageous points.
How to build a high-speed line on the graph
Technical analysis reversal is almost always accompanied by self-drawing lines on the chart. They can be used to identify the major trend, secondary movements, and to determine a turn signal.
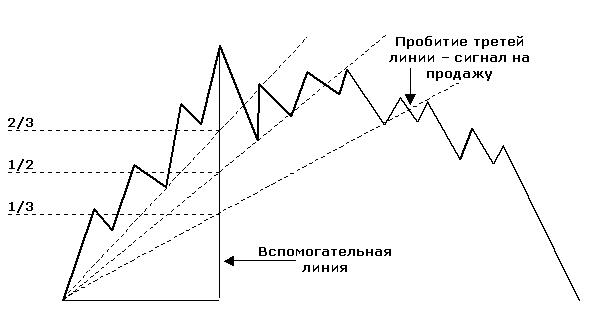
To build a high-Speed line in any trend, for example, on the rising:
- Visually first you need to choose the fragment, a trend which will be analyzed.
- A vertical perpendicular line that connects the minimum and maximum movement (auxiliary line).
- This lines are important points: half of its length, 1/3 and 2/3. For this to work you can stretch the Fibonacci grid.
- Through these points from the beginning of the movement held three lines. They are the basis for the reversal of the trend of the Forex market.
- Further observation boils down to how the price will touch and break the Speed line. As soon as she will surely overcome the last of them, it will serve as a sell signal.

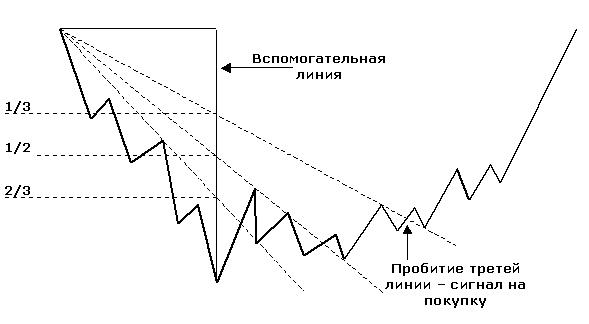
In the case of a downward trend rules of drawing lines are the same. Accordingly, in the case of breaking the last line is a buy signal.

Interpretation of the pattern Speed line
The name of the pattern was because it can be used to see the speed of the development of a new trend and slow the old.
Straight drawn through the given values are a strong support for the ascending and the resistance for the downward trend.
Interacting with lines of this reversal of the trend Japanese candlesticks are testing their strength. Accordingly, once the asset begins to test the first line, it serves as a signal for the slowdown of the current trend.
When the first line is broken, the price is still some time to walk in the hallway between her and the second. Then, as you advance to third straight, the asset may still have some time to test it. After breaking through the last barrier, we can assert that the current trend has lost its force, and there has been a reversal.
Application features of the Pattern Speed line
As continuation patterns, Forex reversal trend to have the features that are important to consider during a real trade:
- The elements of the pattern are applied almost on any time frames – from sentry. Into smaller intervals, there are many noise signals. It may give the impression that began the movement, while on the higher timeframes it will be just a correction to the main trend.
- To identify a market reversal figures can mostly during Mednovosti trade. When out important information that affect the prices of currencies, stocks and other financial assets, players have some time to decide on a new trend. Usually at this time prices make strong bursts in different directions, so you should refrain from transactions.
- The effect of the pattern is greatly enhanced if the reversal is confirmed by other signs: indicators, models, Price Action and important levels of support/resistance that has been repeatedly tested for stories.
- If the last line breaks candles with large bodies and short shadows, it also gives more confidence to the transaction.
The use of the pattern in real trading
To learn how to use a shape for making profitable trades, it is important to determine the time of entry, stop loss and exit point from the market:
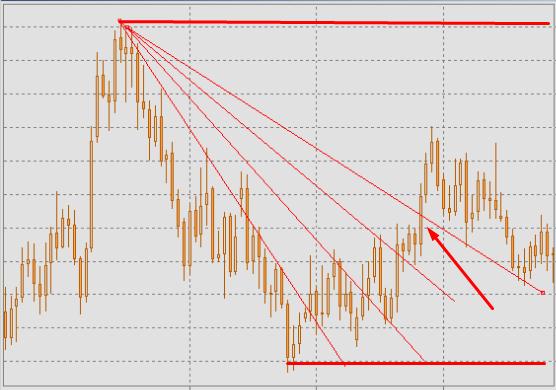
- Entry into the market occurs when a model is fully formed and the candle breaks through the last straight line (arrow).
- Stop loss is placed at the minimum value of the trend (lower red line) or on the local minimum closest to the time of entry.
- Take profit is determined by the level of the beginning of the trend (upper red line).

To build such a template easily enough. Thus he allows is good enough to visualize the situation on the market at the moment. Therefore the pattern Speed of the line can adopt as an experienced trader or a beginner.