
Graphic pattern Flag is a frequent guest on the chart Forex and every trader must know him in the face.

Among the tools of the analysis of the price behavior in the market can be divided into 2 large groups: figures of the trend continuation patterns and trend reversal. The flag belongs to the first category.
How to identify a pattern Flag
It is accompanied by strong momentum in the direction already established on the market trends, and area correction, and then the trend continues its movement. The pulse resembles the flagpole and the flag itself is a correction.

In this case, the figure of a flag on Forex shown on the example chart of EUR/USD in a downward trend. The body of the flag forms a small area of the flat (marked in a lilac background), and the flagpole presented to the large bearish candles that were formed shortly before.
What enhances the effect of the pattern
The figure has some features which enhance its operation:
- on the market there was already a pronounced trend (in this case bearish);
- the flagpole formed of consecutive trend candles with large bodies and small shadows;
- wave correction does not last too long (15-20 bars);
- the output of correction is accompanied by the appearance of a clear candle with a big body in the direction of the current trend.
- if momentum is generated by a powerful, historically-tested support line in an uptrend or resistance line on a downward movement is more likely to be a strong continuation of existing dynamics.
Rules of entry
Schematically, the rules of entry are presented on the figure (for example a bullish trend).

These rules can be described as follows:
- First of all, you need to ensure that the graph formed chart pattern flag. Forex trading often draws on the chart of this figure.
- You can enter only after getting a strong signal on the output of the correction and continuation of the momentum (the graph shows a point where you can set a pending order).
- The stop loss level is set at a maximum rebound against the trend (during the formation of the correction).
- Out of trades when price has already passed the distance, roughly coinciding with the length of the flagpole – on this level you need to put take profit.
Such action requires a figure flag Forex. Breaking the rules basically unchanged.
Application features figure
There is no effective method of trading using the flag model. Forex often shows this figure on the charts, so the strategy is multi-currency. As for timeframes, it is better to focus on the intervals of time and over at him, and also to identify the dominant trend in the market at this time. Since this is a strategy trend following to trade in the market with an implicit trend in growing, flat days (they often fall on a Monday or Friday) to be generally less effective.
Important! This pattern, like many others, it is better not to use, if the market can expect the release of important economic news – better to wait out the day before and they day after, when the background noise will decline, and the market will return to the trend that was before their appearance.
The combination with Fibonacci lines
For the best visual graphical representation of the pattern flag and a clear idea on the termination of the correction and continuation of the trend dynamics can take advantage of the long tried and tested method and apply on drawing the Fibonacci grid, as shown in the diagram below.
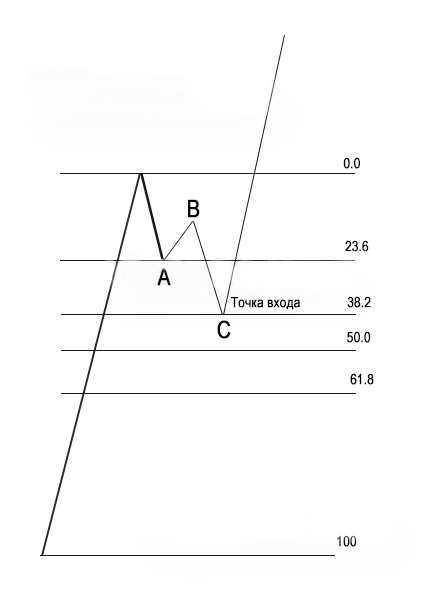
Stretchable mesh from the beginning strong trend momentum to its maximum point, after which the correction began. Fibonacci lines serve as a good benchmark in cases where the flag has not emerged – in this case the price breaks the 50 level and then maybe either a long time to go sideways, or even go back to the beginning of the pulse movement. Both these cases are evidence that in the near future the trend continuation is not expected.