Technical analysis for binary options: trading principles
What is a technical analysis for binary options? If briefly – that is the basis of all the basics of binary trading. Analysis of binary […]
What is a technical analysis for binary options? If briefly – that is the basis of all the basics of binary trading. Analysis of binary […]

Pin bar – what is it? The so-called strong candlestick pattern, which is easy enough to recognize. But if the experience is not enough, it […]

The study of price behavior based on graphical models is the most popular tool of technical analysis. One of such models is the pattern of […]

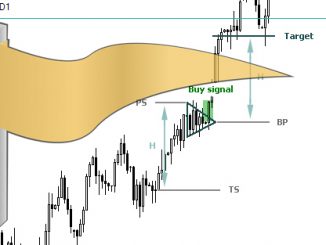
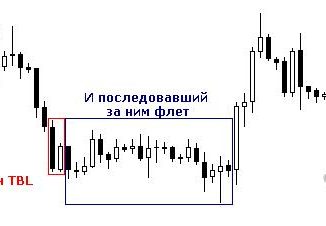
Graphic pattern Flag is a frequent guest on the chart Forex and every trader must know him in the face. Pattern Flag Among the tools […]
In trading, there is a group of methods, which defines the conditions for continuing the current market trend. In the graphical analysis, there are many […]

In the Arsenal of the trader, there are different tools and strategies to trade. The most valuable of them can be considered as those which […]
The analysis of the dynamics of price movement in Forex, in particular, by using various graphic shapes that form the candles, and combinations thereof. While […]

On the chart regularly produces many different patterns and a triangle Forex is the most intuitive and easy to use. Such a model typically is […]

Candles-doji – these are common setups in the strategy Price Action. Forex is the most striking example of their application. They do not have bodies, […]

Trade the Price Action requires a careful analysis of the arrangement of the candles, their structure and combination with other bars. All models can be […]

Among reversal patterns Figure Head and shoulders Forex pattern is a classic, which still has not lost its effectiveness. Figure Head and Shoulders in Forex […]

Figure Double top/Double bottom Forex – classic and time-tested pattern.Each trader must be able to predict the weakening of the current trend with a further […]

The patterns of Price Action include a reversal of trend on the Forex and the figures continue the existing trend. A clear signal of reversal […]

Pattern Rectangle on Forex, which can occur in both bull and bear market, confirms that the price will continue in the same direction. Its fairly […]

Among reversal patterns Pattern Dragon on the Forex – one of the classic versions. Even the beginner will easily identify it on a real chart. […]

Reversal patterns such as figure Diamond Forex different in that it is able to predict the beginning of a new trend of price movement in […]

Among reversal patterns one of the most characteristic and distinct is the figure of the rook on Forex. It is easy to determine even for […]

For the analysis of the price behavior are often continuation patterns that allow you to consistently make a profit through trade in accordance with the […]

The figure of Spike on the Forex is not a popular tool of graphical analysis, but still quite effective in certain cases. It is advisable […]

To Forex analysis of the figures give the most reliable signals for market entry, often use additional tools. For example, pattern bow Tie on Forex […]

Many of the figures of the trend reversal Forex are based on classical models – patterns Price Action. Along with them, there is a whole class […]

Forex analysis of the figures allows to define the objective evidence of the current trend and predict its shift to another. One of the most […]

Technical analysis of the Forex market includes many patterns that when properly applied are working effectively and bring a stable profit. Some of them predict […]

Forex technical analysis for today represented by a large number of different models of Price Action, among which are two great classes: figures of continuation […]

Cup with handle on Forex – bullish continuation pattern where the upward trend was halted and went down but will go up again at the […]

Technical analysis for beginners is the study of the simplest figures of Forex that are easy to see on any chart. Such figures include the […]

The Spring pattern is a figure of the Forex market relating to strategies Price Action and consisting of many candles that are generally the assumption […]
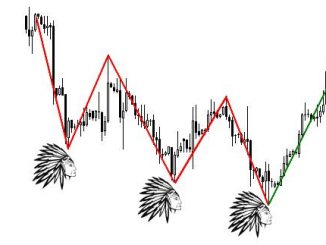
“Three Indians” – the figure of a graphical analysis, first described by Linda Raschke, due to its ambiguity and complexity definition, is not a popular […]

Shapes Hammer and Hanging man, and many other technical patterns Forex, are very popular among currency traders. The main reason for this popularity is the self-sufficiency […]

Technical patterns Forex, for example, Pattern a Long island Forex are prominent in training programs for traders. This family of analytic tools, diverse and numerous. No sense […]

Round patterns the Forex are among the popular tools of graphical analysis. More typical forthe stock market, these figures have been adapted for medium-term trading […]

Yo sen and In sen – reversal patterns and continuation of trend, which are well known traders in the Forex market. His popularity data patterns, and […]

The pattern of Absorption and Price Action recently reached its peak. But it is necessary to consider the prospects and dangers that carry these graphic […]

Pattern 1 2 3 is one of the most famous and the most popular among traders in the Forex market graphic patterns. Such a high […]

Pattern 5 0, as well as other graphic figures Forex is very popular among currency speculators and investors. The main reason for this popularity is […]
The pattern of Three movements according to the method Linda Raschke is a harmonious pattern that are popular with traders in the Forex market very popular. The […]

Pyramiding anti-martingale or Forex is the acceleration of Deposit Forex at a strategy, causing great interest among the traders in the Forex market, especially beginners. Pyramiding in […]

Many of the figures Forex actually apply equally when observed trend is ascending and descending. However, there are exceptions that work out well only in […]

The use of such a tool in technical analysis, moving average method, has proved its efficiency and simplicity, thanks to many years of observations of […]
All pieces are Price Action are used to determine the continuation of development of trend to obtain a signal of reversal. A simple example of a reversal […]
Some setups Price Action is based on the use of numerical regularities, so they called harmonic. Such patterns are less common, but they are particularly […]

Patterns Gartley was first presented to the trading public back in 1935. These figures, like other harmonic patterns are based on the principle of symmetrical […]

The pattern inside bar as a figure outside bar rightfully deserve the title the most controversial. In fairness it should be noted that these candle […]

Trend reversal is the most anticipated event in the world of Forex traders. Each of them wants the first “to enter in a luxury car” […]

The analysis of financial markets is a lesson, though very fascinating, but very troublesome. Especially for new traders in the Forex market who still believe […]
Price Action or indicator-free trade in recent years significantly expanded the circle of admirers. This trading system based on graphical analysis of price charts and […]

A combination of Japanese candlesticks clearly and, most importantly, to determine the trend as upward and downward. There are also candlesticks that are formed on the chart, […]

When a new trader enters upon the path of knowledge of stock trading, there is a natural desire to gain knowledge from those whose reputation exchange […]

Japanese candlesticks in Forex long shot traders and more popular, because graphic shapes Forex have many advantages including leader visibility model. Dragonfly Doji on Forex […]

Chart patterns on Forex represent powerful analytical toolswith which the trader can easily receive the necessary information about the market state and prospects of further development […]

Candlestick analysis Forex gained popularity among traders in financial and stock markets. But in fairness it should be noted that customer loyalty candlestick analysis in the […]

Doji candle is a very popular tool of graphical analysis. The candles on the chart Forex, despite their lack of independence and the variability of […]

Analysis of figures on the Forex is one of the methods of the technical approach to forecasting of price behavior. Graphic shapes are very popular, the growth […]

The price chart in the Forex is the main source of all the available “ordinary” trader information. It is a basic tool for all kinds […]
Copyright © 2024 by i-like-trading.com