
The analysis of the dynamics of price movement in Forex, in particular, by using various graphic shapes that form the candles, and combinations thereof. While some talk about the upcoming turn, while the others keep on with the project, such as the figure of a Wedge in Forex.

It is a classic pattern of Price Action and has two main varieties.
How to determine the shape on the chart
Visually, the wedge shape looks like a classic scenario of the trend with a strong trend and gradually updated the local maxima or minima in the corresponding direction. If you were to draw 2 lines connecting the highest and lowest value prices, you get a triangle, elongated in the direction of the price movement. Hence the name of the pattern. So, a triangle is formed when the bull market:

You can describe it the following characteristics:
- pronounced bullish momentum, is represented by several bullish candles with large bodies and small shadows;
- price adjustment is not greater than half of its momentum;
- each successive low price is higher the previous one.
Accordingly, in a bear market can often meet the figure of the descending wedge:
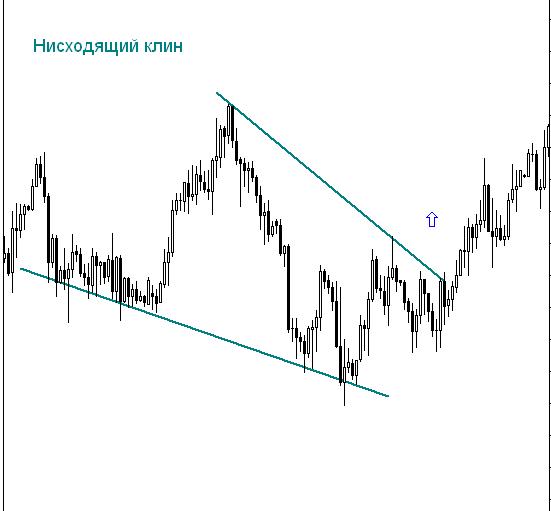
A description of its characteristics mirror:
- a few strong bearish candles, with great body, sequential (stepped) down);
- price adjustment is within half of its original movement;
- each subsequent price high is below the previous one.
The figure reflects the mood of the players after a long flat, when you open a volatile European session, and also serves as a good indication of the continuation of existing trends.
Important! The requirement that each successive maximum (minimum) is below (above) the previous is not always followed perfectly. In fact, some price updates might be lower or higher, however, the overall trend of price movement will fully comply with the prevailing trend. Therefore, this requirement in itself is not too strict.
Which increases trade efficiency
Wedge-like figure of technical analysis can be used more confidently in those cases when there are following signs of the trend continuation:
- At the time of emergence figures in the market already there was a steady trend in accordance with which is formed the current shape is the wedge.
- Large body, small candlestick shadows also talk about the mood of market players.
- The beginning of pulse movement from the important levels that have already been tested as support or resistance (for the players psychologically more significant levels with round price values).
Also, the pattern can enhance and other shapes Price Action, and indicators, have proved their reliability during long-term testing.
Trading strategy on the basis of figures
Use figures in specific trading systems is based on the fact that his appearance is a sign of the continuation of price movement with the trend, accordingly, should be considered only a trend trade. On the formation of the pattern is judged when its correction formed a triangle with elongated in the direction of a price trend angle. Accordingly, the rules of trade are such (for example a bullish trend):
- The entrance to the market in the direction of the trend is after the fact, when they received clear signs of the wedge and the break of the correction (typically a few bullish candles going up the steps). Visually they need to break the upper boundary of the triangle.
- Stop-loss is set at the highest low, which formed price during the correction.
- Question about take profit less obvious. Typically the profit is fixed after the end of the impulse move up. You can determine this point according to other figures Price list Action, for example, embarked on two level bullish and bearish candle.
Trade figures rising wedge shown in the figure below:

The results
The figure of a wedge in technical analysis are often not used during the release of important economic news. The fact that the market impact of major economic data in the country is reflected in the strong pulses in one direction and then the other. In this case, it is difficult to judge what the trend will develop in the near future.