On the chart regularly produces many different patterns and a triangle Forex is the most intuitive and easy to use. Such a model typically is displayed on intraday charts. The optimal time period for their occurrence is considered to be noon, when the manifestation of consolidation – the lateral correction/sideways trend with a narrow range.
Triangle often signifies a possible continuation or early reversal of the trend line. But most traders think it is classic pattern that is the continuation of the trend. Different specialists use different ways to describe the details of the Triangle, but there are General provisions, which no one denies.

It is worth considering that on the chart during the day can form several types of this shape, forming so to say “a pattern of triangles” and each of which requires sometimes diametrically opposed action. So it is necessary to timely identify different types of triangles, to distinguish from each other and know what to do with the appearance of each species. Sometimes just nothing to do and don’t need.
The Triangle in Forex: rule breaking and types
There are four main types of Forex triangle, most frequently occurring on the chart. All these figures have one thing in common a similar phenomenon: either each vertex of the trend line above the previous one, or each minimum lower than its predecessor, which in combination with the lines of support and resistance forms two different, but similar in the nature of a triangle. But I can be both things at the same time that other forms of type 2 figure.
Rising
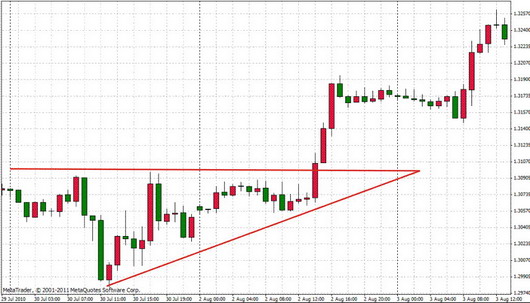
The figure is formed at a time when lower highs are starting to increase and at a certain period there is an intersection with the horizontal resistance line that forms the shape of a Triangle on Forex.

Bottom-up type indicates the predominance of bullish trend and signals a potential trend continuation and the appearance of consolidation. Therefore, when the price usually breaks the upper border and should set a buy order slightly above the resistance level.
Descending
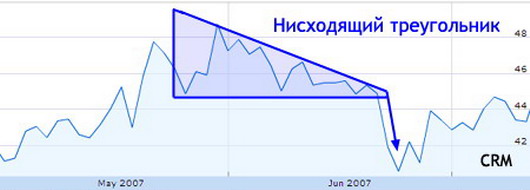
The result of it is decrease price value, regardless of the previous trend of activity. In General it is the opposite of the ascending triangle, so video support is fixed at the lower end of the graph, and the order of the peaks decrease until the crossing of the lines.

As a rule, after reaching the point of crossing, the trend continues to fall below. In this case, the best option is to set a sell order just below the support level.
Symmetric
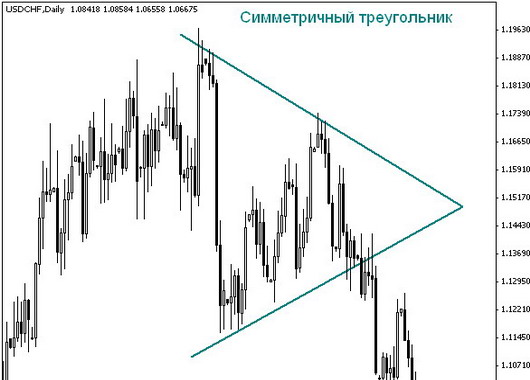
Occurs in the form of lower highs and rising lows. If you hold him on the line, the shape will resemble an isosceles triangle. In this case, neither the sellers nor the buyers can’t drag the trend in his side, and he fades, intersect at a certain point.

But, often, the breakout of this triangle occurs in the direction of the trend and in line with this, you should place the order. A similar pattern appears in practice quite frequently.
Expanding
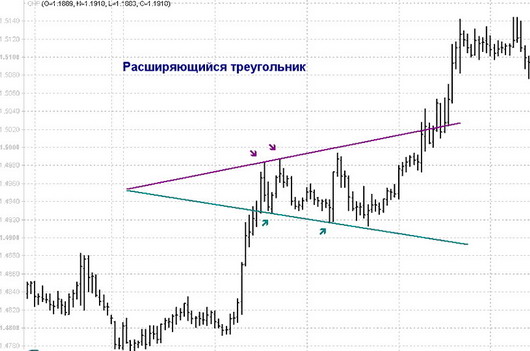
Often appears on the chart of the expanding triangle Forex, a figure who looks like the discrepancy is support and resistance in different directions.

He usually appears in case if market participants fear the high indicator of overbought and oversold – stop resulting in further action. Appeared lull gives the right to join trade for swing traders, rock cost position. After the appearance of the breakdown of all currency quotes extend in his direction and investors running after him, starting to form a turnover.
Professionals suggest the beginners not to carry out the transaction within dispersed model, since there are no accurate signals for buy or sell.
The results
If you define the triangles on the chart yourself hard, it is possible to download the indicator pattern is a Triangle. For this purpose, there are universal indicators that identify on the chart a variety of shapes such as, for example, Pattern Graphix. It is quite comfortable and accurate, and, most importantly, gives a sound signal about the appearance on the chart of a particular figure. He also gives recommendations on trade, but such decisions are better not to trust automatic advisors.