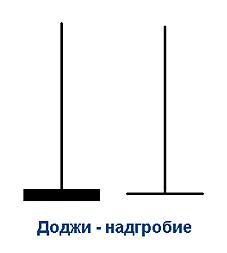
Candles-doji – these are common setups in the strategy Price Action. Forex is the most striking example of their application. They do not have bodies, but they have quite a large shadow. Some of them by themselves are quite a strong signal, which can be used to make assumptions about the future behavior of the trend. One of them – the figure of gravestone on Forex.

To successfully use the setup in the trade, it is necessary to understand the essence of Price Action. What is it and how is it used in trading? This method of forecasting price movements based on her behavior in the past and present. When using candles: their bodies, the shadows, the dominant development direction (trend).
Trading strategy based on Price Action
Often traders who use trading systems based on technical analysis use a variety of indicators and combinations thereof that can greatly complicate the picture and give conflicting signals to enter the market. To enhance the operation indicator strategies appropriate solution would be the analysis of the graph, that is with candles and their various combinations, which in themselves are sufficiently clear signal.
Trade on Price Action often combined with other methods of technical analysis, as well as with the actual data at the current market situation:
- important economic news;
- the presence of established strong levels of support or resistance;
- the current trend and its strength.
A gravestone is seen as the image of the behavior of the bulls that tried to continue the uptrend, but lost the fight the bear: the body of the candle has not formed – the prices of opening and closing coincided, and the long shadow up gives a signal that soon the price will reverse down. This feature relates the pattern to the divergent models.
How to see tombstone on the chart
Setups Price Action often consist of a certain combination of two or three and even more candles. In this case, their interpretation is complicated by the subjectivity of the perception of each trader. Mostly the models of the Price Action are composite, but some are represented by one candle. Pattern a gravestone or tombstone is a classic example of this pattern.

This candle is easily identified by the following characteristics:
- resembles an inverted “T”;
- the body is virtually absent (or very small);
- the upper shadow is distinct, clearly visible;
- the bottom is almost missing.
“Tombstone” describes well the behavior of players in the market and serves as a signal for the change of bullish trend to bearish.
What enhances the effect of the candles
Tombstone takes on added force that allows to predict further price movement. This happens in the following cases:
- After a strong uptrend, formed bullish candles with large bodies and small shadows. This signal is the strongest manifestation of this. This means strength of bulls declined sharply and the price is likely to go down.
- Near the strong and proven resistance level. Psychologically powerful are the levels with round values (0,2500; 1,075; 2,000 etc.).
- The emergence of bearish candles with large bodies and small shadows – a clear signal to enter the market. While the fall in most cases will be at least equal to the spike rates.
Conclusion
For the first time after the release of important economic news on the schedule can occur these price surges and “tombstone” can give false signals. Therefore, it is recommended to apply it in Mednovosti trading period.