
The study of price behavior based on graphical models is the most popular tool of technical analysis. One of such models is the pattern of a Star, having several varieties, depending on certain combinations of candlesticks.

Features of the combination of candles, that is, the patterns allow us to more accurately judge the future movement and make profitable trades.
Shooting star
Pattern shooting star is one of the most simple, because it consists of one candlestick with the following:
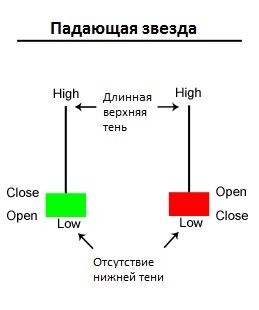
The figure has the following features:
- the candle color does not matter (it can be as “bullish” and “bearish”);
- the body is short, often has the form of a square;
- the upper shadow is very long (at least 2 times longer than body), and the bottom is either absent or very slight;
- it opens typically with a gap up (as shown below).
Important! To ensure the appearance of shooting stars, you need to verify that all given conditions are met. Even if one sign is missing, talk about the emergence of the pattern is pretty risky.
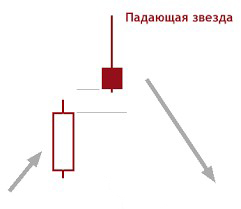
This candle indicates the beginning of nucleation in the market bearish trend. The signal is amplified in the following cases:
- if the upper shadow is very long (exceeds the body 5 and more times);
- the lower shadow is absent;
- if the market for a long time there was a bullish trend and gap shooting star from the previous candle is very noticeable;
- it was formed in the area previously confirmed resistance level, but did not penetrate his body.
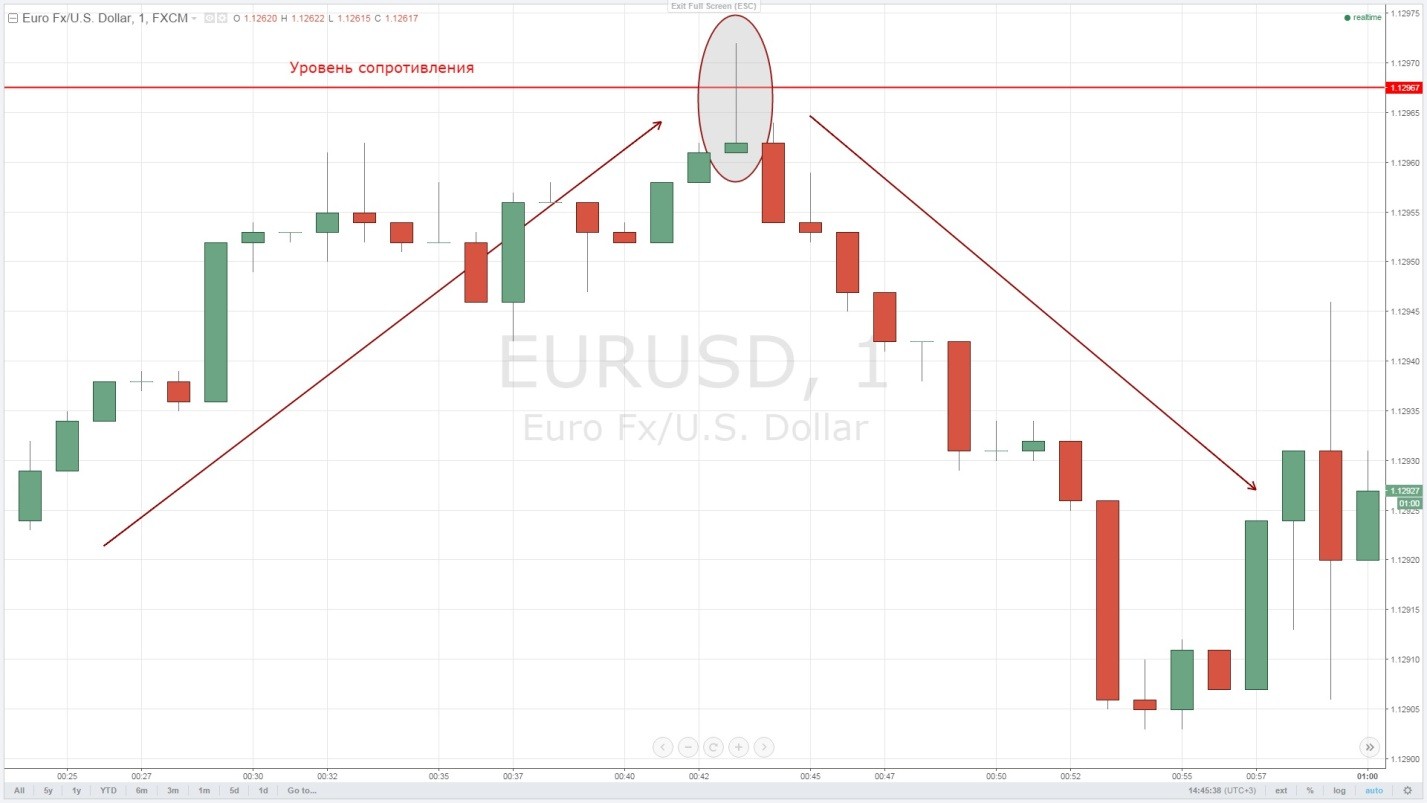
You need to pay attention to the fact that the Price action method are described figure is not one of the strongest. As a rule, you should wait for other signals to make a more correct conclusion. One of them is the next candle. If it is bearish, clearly has a great body, a little shadow – this is evidence of the appearance of falling stars. The pattern can be considered as another condition for confirmation of a trend change, that is, it can be used in a trading strategy as a secondary symptom.
Morning star
Among the graphical models can often be found the opposite, that is, those that are mirror images of each other. These include, for example, the pattern of morning and evening star. These romantic words are called simple shapes that serve as a signal speaking about a possible change of trend. So, the pattern of the morning star warns of the possible weakening of the falling trend and change its bullish movement. The model consists of three candles, as shown in the figure below:
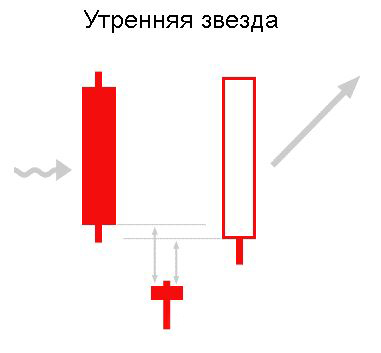
For the morning star is characterized by the following features:
- the first candle is bearish with a large body and small shadows;
- average – with very little body or even without him, with any color and shade is also small in size;
- right shows bullish momentum – she has a great body, with minimal shadows and typically closes above the first.
Important! Between two adjacent candles must exist a short period – a kind of “local” gap. Only in this case we can speak about the current pattern.
The model is enhanced by the following factors:
- if body extreme candles are large in size and shade very small;
- if the average candle gives a strong shadow down;
- when the figure is formed near important support level.
Pattern well describes the mood of market participants, if it were lengthy drop-down trend. The last attempt of the bears to lower the price (left candle) reflecting uncertainty in the market (middle), and then a strong jerk in the opposite direction (right) serve as a fairly reliable signal of a trend change.
Evening star
By analogy with the morning pattern the evening star is its complete opposite. On the chart it looks like this:
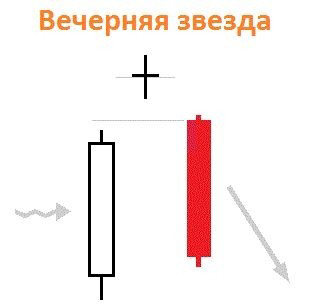
Such graphic figure is the basis to think about the change of bullish trend to bearish. It is, as in the case of the morning star, is enhanced by the presence of important resistance near the close of candles, as well as the peculiarities of the body left and right and shadows of the middle candlestick.
Important! Change of trend in the market is always considered a less likely event than its sequel.
Therefore to expect immediate changes trend without confirmation of the additional signals is quite risky. Typically, a fading trend is over a relatively long flat, a period of indecision in the market. We can expect, in what direction will the price to exit the flat and only after the actual confirmation of the direction of movement to open position.
Three-star reverie
Some of the models of candlesticks in Forex have quite lengthy names – so, pattern is a three-star deep in thought in another way referred to as “repulsed the attack three white soldiers.” For a complex name lies the figure of the simple form shown in the figure below:

The figure consists of three (sometimes more) consecutive bullish candles that rise up consistently, reminding stage. The opening price of each subsequent is usually located at the level of the previous closing. The latter consists of a small body, can give a slight (typically the body) shade up. If then there is a strong bearish momentum (it can be seen by bullish candlesticks with large bodies, short shadows, that also go down speed) – so there is a change of the upward trends for the U.S. economy. The model can strengthen the following factors:
- it was preceded by a long and pronounced bullish trend;
- the last bullish candle gave a strong shadow up;
- she also formed near a strong resistance level;
- emerging bearish candle large body.
Conclusion
To predict the market with absolute guarantee will not undertake any, even the most experienced trader. So use only one or two figures to understand what is happening clearly enough. Strategy need to build meaningful and continuous test – only your own experience will enable you to understand the logic of the market and to build a profitable trading system.