
Technical analysis of the Forex market includes many patterns that when properly applied are working effectively and bring a stable profit. Some of them predict the continuation or reversal of the current trend – the latter applies to pattern a Tube top and a Tube bottom.

A characteristic feature of this model is a simple visualization of any chart is to find such a clear candlestick combination can even novice trader.
How to find the pattern on the chart
Technical analysis of the Forex chart allows to predict the price behavior of any asset on the basis of the current situation. In most cases, the price chart is a curved line that moves evenly. However, there are cases when an asset makes a sudden jerk downwards or upwards, after which the price returns to the same distance.
Such situations are referred to as price spikes and they are the basis of the examined figures of technical analysis Forex.
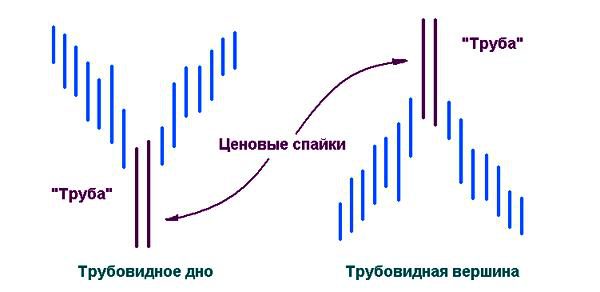
To detect a pattern on any chart, it is enough to consider 3 conditions:
- There is the current, pronounced trend.
- At some point, price makes a significant leap in the direction of the current trend. This breakthrough displayed relevant candle with body higher than the previous several times.
- After that there is an opposite candle, which is often on a par with the previous one. The asset steadily unfolding against the trend.
Externally, the pattern really looks like a tube: in a bull market it forms the top, bear bottom. It reflects the characteristics of the market at the time of exhaustion of the current trend. The dominant players are doing the last serious attempt to raise or lower the price, however, immediately rebuffed – is formed the same large candle in the opposite direction. This is the turn signal.
Conditions, the reinforcing effect of the pattern
The basics of technical analysis Forex always take into account not only the candlestick patterns, and other factors that directly or indirectly support the assumption about the future development of the situation. The main indicators include:
- the key levels of support and resistance, determined by the history of the asset;
- indicators to predict price movement on the basis of mathematical calculations.
In the case of pattern a Tube top/bottom, there are several conditions that increase its action:
- An important rule of technical analysis in Forex – the higher the timeframe, the stronger the received signal. The model can be sought at any interval to fit under your strategy, but it is safer to stay with H4 and above.
- If price spikes are formed near important levels of support or resistance that have already been proven repeatedly in history – this gives more confidence to enter the market.
- The larger the body size of the candles that make up the spike, the stronger the signal. The size of each subsequent candle is larger than the size of the previous candle is more than two times.
- If spikes are formed to increase the volume – it strengthens the signal. In this case, a great option is the situation when the volume of the candle on the left more than the right:
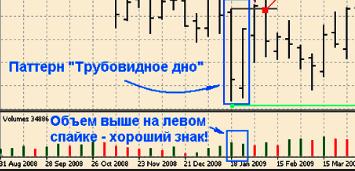
The red dot here is the entrance to the market
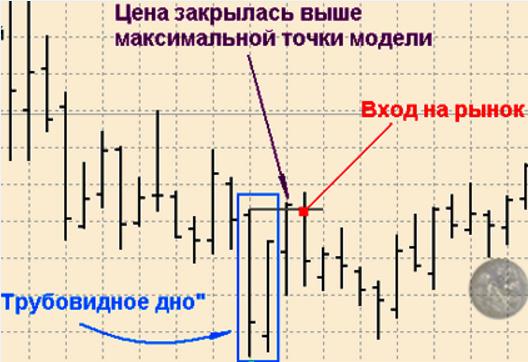
Also, it is important that after the formation of the second spike bar in the next candle has closed above all spikes as shown on the chart:
Trading rules based on pattern
If you are Forex technical analysis online, in real time, to see the shaping of a shape on the price surge, which is usually accompanied by significant volume growth.
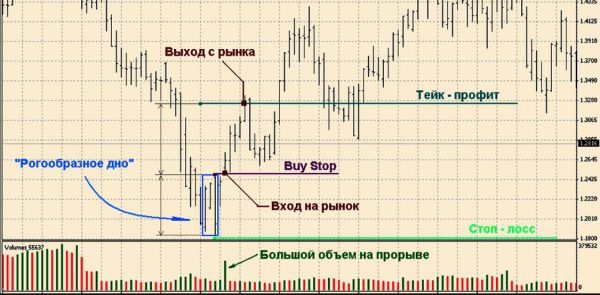
Sliding price spike may not occur immediately, but after 1 bar, however, it does not change the essence of the signal, it is still good to work out the trend reversal. In this case, the figure is called a horn-shaped bottom or top.
Trade rules:
- Market entry is carried out only after the formation of a sliding spark in spike. It appears next to or one after the left the bar.
- Stop loss is fixed at the closing price of the left bar in spikes. Visually it’s low price (for a tube bottom).
- The profit is fixed after the price will be at least the same distance, which is equal to the maximum size of the adhesions.
To start learning technical analysis you need with the most simple of patterns. A tube-top or bottom are perfectly suited for beginners – this model can be easily interpreted and gives profitable results.
Forex technical analysis – videos: