
Forex technical analysis for today represented by a large number of different models of Price Action, among which are two great classes: figures of continuation and reversal of trend. The latter include pattern Crab on Forex.

He pretty well revealed on the chart and gives good enough signals to change the current trends to the opposite.
How to catch a Crab or a search pattern on the chart
Forex analysis of the figures suggests not only an accurate interpretation of different patterns, but also to find differences between the different models, which can visually be very similar. In the case Crab is a particularly urgent task: it can be confused with a Double top/bottom or a model Head and Shoulders.
To confidently navigate in the graph, in this case, you must use a Fibonacci grid. Schematically, the model will look like.
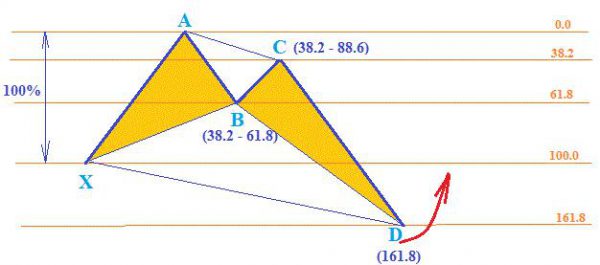
In this figure technical analysis Forex have the following features:
- The pattern is rendered as two triangles (two claws).
- Price makes two consecutive pulses against the trend, but every time is rolled back.
- Rollback updates latest price minimum (maximum bullish).
- If you stretch the grid of the maximum value of the left claw (A) to the most profound rollback (D) the beginning of the first pulse (X) must lie at 100.
- Then the center where the two claws (C) coincides with the level of 81.8, and the second local maximum, from which the asset again went with the trend, is the level of 38.2.
It is the reversal of the price from the D point provides the signal to turn. He must be confirmed by the formation of candles with large bodies that consistently go in the opposite direction.
Market analysis today, Forex allowed us to develop a lot of patterns, but in most cases they do not coincide fully with the theoretical schemes. Below you can find real Crab pattern formed on the downward movement.
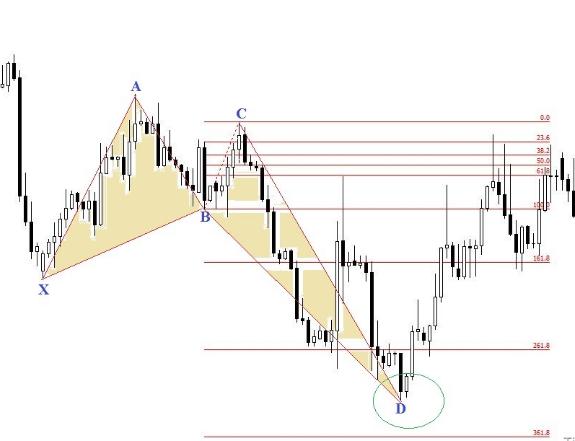
It is seen that the corresponding points do not lie exactly on the above-described Fibonacci lines. However, the approximate matching and visualization models can accurately say that the market has formed a pattern of the Crab.
It is often called harmonic figure, since the analysis of the charts shows that he is in most cases definitely correlated with the Fibonacci lines. The possibility of using mesh highlights the Crab as a special class of shapes Price Action. It appears on the market infrequently, so finding a Crab is considered a big success.
That amplifies the signals from the Crab
The pattern itself is sending quite reliable luck. While technical analysis of Forex market allows to get the additional characteristics that significantly increase the chances of success:
- The longer the current trend and the more dynamic he was, the higher the probability of a reversal.
- If point D (the second claw) lies at an important level of support or resistance – this greatly increases the probability of change of trend.
- The pattern can be visualized on different timeframes, but it is safer to search at intervals of not less time. Forex broker says: the older the frame, the more reliable the signal.
- The appearance of large candles, updating the lows or highs to confirm a change of trend.
- If the reversal is confirmed by other analysis techniques Forex, for example, is technical indicators also increases the probability of a correct prediction.
Online Forex analysis indicates that the pattern of Crab, like many others, works well during Mednovosti trade. If the market is waiting for important economic data – this may cause the price to move in different directions. In this case, the Crab is likely to give false signals for the transaction.
Trading strategy based on pattern Crab
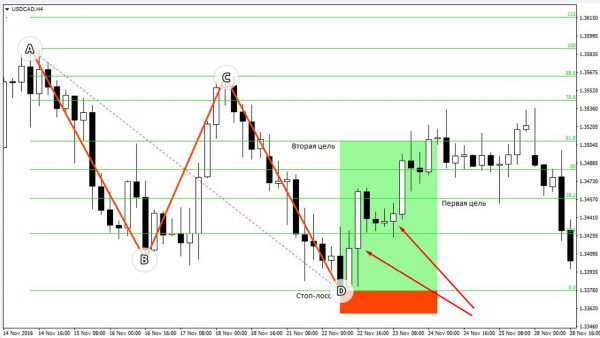
After the discovery of the figure on the chart to determine the entry point, stop loss levels and take profit will not be easy:
- The entrance is immediately after the reversal from point D or at the next correction.
- Stop loss is fixed also on the level of point D.
- As for take profit, we can consider two objectives. The first is the level of 38.2, the second – the 61.8, as shown on the chart.
The harmonic pattern Crab is a rare figure. However, it is worth it to wait for it for a few weeks or even months. The signal is reliable, and the ability to see the emergence of the trend provides the most profitable deals.