
All pieces are Price Action are used to determine the continuation of development of trend to obtain a signal of reversal. A simple example of a reversal of the trend pattern of “piercing”, to determine which is the graph on the naked eye. When you consider several trading conditions it is possible to receive a stable profit through the use of a trading system based on this model.

How to find the pattern on real chart
To detect such simple figures the Price Action will turn any beginner. Conditions of formation of the model are the following:
- The market has developed a distinct trend (e.g., bear).
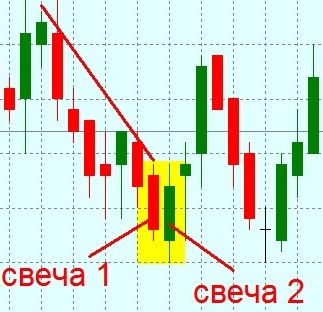
- At some point the candle is formed with a large body going in the direction of the trend.
- The following candle opens below the closing price of the previous one and has the opposite direction.
- The body of the new bar is about the same size as the previous one. Candle closes at a level no less than half of the body previous.
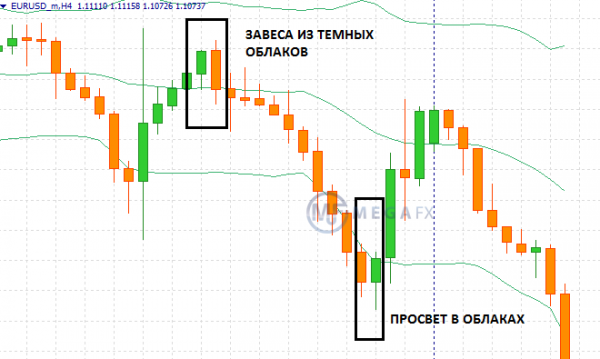
The pattern is formed and in a bull market. In this case, it looks like a mirror and has another name – the Veil of dark clouds.
How not to confuse the “piercing” with similar figures
Any trader it is important to understand how to identify a trend reversal, because market entry at the beginning of the birth of the trend provides a good profit. The main difficulty of this problem in order not to confuse the turn signal with the continuation of the current trend.
Below discusses several patterns that are usually formed in a bear market and similar to the “piercing” but they testify to the preservation of the existing trend.
The push – pattern is formed from a large bear and a small bullish candle, which does not reach half of the body of the previous bar. To enter the market, not made a key condition for the figure of “piercing”.
At the base – in this case, formed a small candle and open price close of the bullish bar is on the bottom (the closing price) of the previous candle.
At the base of the bullish candle again not reaching half the body of the previous candle. However, even following a large candle, which moves in a turn, does not give a reliable enough signal to log in.
How to apply the pattern in real trading
For the use pattern it is necessary to consider several trading conditions:
- The entrance is only at the moment when the model is completely formed, and the third candle goes in line with the forecast.
- The strategy is applied on time frames below the M30 is not.
- Stop Loss is set at the opening price of the bullish candle (i.e., the nearest low).
- Take Profit is based on the assumption that the price will be at least to the nearest high, which started the bearish trend. However, the first fixing of profit is often performed during the correction.
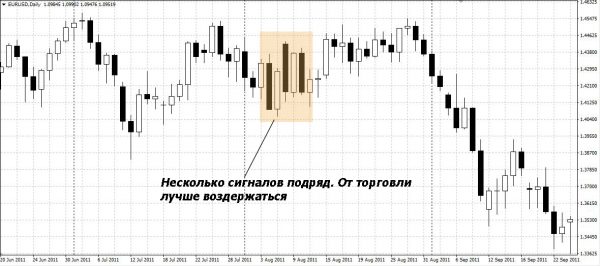
Important! Trade is carried out only in a trending market, i.e. in the period of greatest volatility. If there are several signals in a row, entering a trade unwanted – the market is in an indeterminate state.
Which increases the profit probability
Typically, these are simple candlestick patterns and other figures Price Action used in conjunction with other signals confirming the correctness of the input:
- Application of additional technical analysis tools that show a reversal, for example, the Macd indicator and Alligator indicator, greatly enhance the probability of success.
- If a reversal pattern is formed near a strong support level, which has been repeatedly tested on the price history, you can enter quite confident.
- If on different time frames there are contradictory picture, it is better to wait a more suitable time or you can choose a signal older interval.
- Finally, it is better to wait out the time of important economic news and the waiting period, when the price first goes flat and then can make sharp movement, forming false signals.
Application of the considered pattern is better to combine with other signals, because the market is better to consider the maximum possible number of indicators. With its intuitive logic and simple picture of the model “a gap in the clouds” could be the first step in the study of price movement for the novice trader.