
Some setups Price Action is based on the use of numerical regularities, so they called harmonic. Such patterns are less common, but they are particularly accurate.
See harmonic setups Price Action is much easier – because they are based on a specific price value, the situation and the subjectivity of a trader plays a much smaller role.
How to see the pattern on a real chart
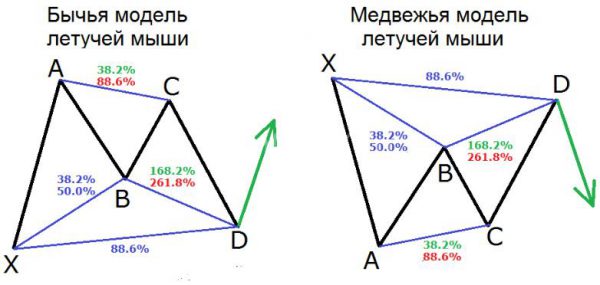
All models of the Price Action are divided into 2 major groups – the model of trend reversaland pattern continuation. Consider the pattern “Bat” refers to the last class. On the other hand, they has its own peculiarity: the figure belongs to the group of patterns Gartley. They are used along with Fibonacci lines. The rules of the grid and the detection model is quite simple. For bullish trend, for example, they look like this:
- The market formed a clear uptrend.
- At the moment there is a correction with a strong price movement against the trend.
- The Fibonacci grid is stretched from the start point of trend to the maximum local peaks A.
- Based on this figure, the strategy has its own “flavor”: it provides for the need to construct a second grid that stretched from the maximum level of falling prices as a result of the correction to the maximum vertex A.
The result should be a picture with the advent of point C, which will have exactly the 61.8 of the second grid. From point C the price will surely go against the current trend, dropping almost to the level of the beginning of the trend: point D should be at the 88.6 level. And it was from her, the asset will again begin to move with the trend, and thus it is possible to enter the market.
After the price reached point D, it in most cases continues to move in line with the current trend, and goes up to maximum point A. a Schematic figure is shown in figure:
How to use the pattern in real trading
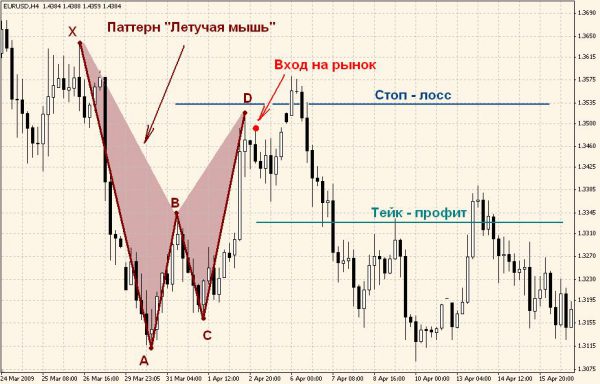
As already mentioned, the figure gives no indication of trend reversal. However, it is well defined point, from which, the asset back on the current trend (point D). Trading rules are quite simple:
- The Stop Loss level is placed with reference to point D, usually to this level asset in the near future will not be refunded.
- Take Profit is fixed at the location, and the ultimate goal is determined by the point A as the price is almost always fully recoup the initial movement.
How to increase profits
Traders often try to see a strong signal of trend reversal or even to recognize the reversal of the trend without indicators. However, models continue, there is one obvious advantage – they predict the development scenario of the current trend, which always has a bofgreater probability.
We should pay attention to additional cues that give much more reasons to enter:
- Such setups Price Action as the Figure of “the Bat” is used most often in the time frames below H1 are not, however, permissible to use inside the day (below M5). When there are conflicting pictures at different intervals, the rule is triggered, the older the frame, the more reliable the signal.
- If you apply for more technical analysis tools such as indicators – it also increases the chance of a profit.
- Asset makes a more confident movement from point D, if it is exactly or approximately coincides with strong price levels of support or resistance that has been repeatedly tested on short stories.
- The application of the strategy within the day should take into account the impact of important economic news. In anticipation of significant power of news in the publishing market can make impulsive, chaotic motion, which create a lot of signals. At this time you should refrain from bidding.
- Finally, candles and of themselves are powerful enough indicator. If the market has developed a distinct trend, and its continuation is accompanied by the formation of large candles with large bodies is a good additional signal.
Harmonic pattern Bat to detect simply. For this you need to correctly use Fibonacci lines. So for beginners familiarity with the market can begin with this system. As for the traders with experience, and familiarity with the pattern will become very useful from the point of view of enriching their collection of effective trading systems.