
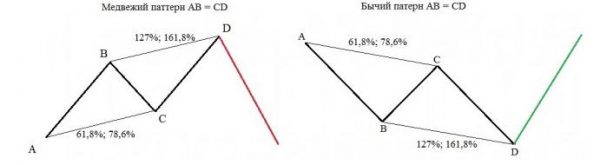
Patterns Gartley was first presented to the trading public back in 1935. These figures, like other harmonic patterns are based on the principle of symmetrical movement of the price of the trading instrument, which demonstrates a different model Gartley, called AB=CD

Patterns Gartley and Pesavento – it was a harmonious model known to modern traders in the Forex market, and represent the implementation of the refined, and very importantly – optimized algorithms
For almost a century, the history of these models has repeatedly fine-tuned. On the basis of new analytical tools. In particular, the attention of traders the proposed program to determine patterns Gartley and harmonic patterns indicator. And today, the indicator patterns Gartley and the adviser on the basis of patterns Gartley presented in the base configurations all known trading platforms.
Here is considered one of the “young” members of the “family” harmonious patterns, namely pattern a Shark.
Shark Pattern: the appearance and the algorithm of formation
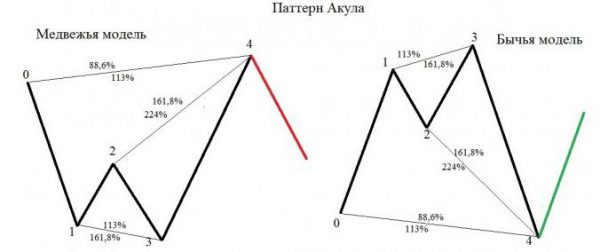
Like many other harmonic patterns, the Shark consists of five points. Its form model reminiscent of the eponymous fin sea predator, rising over the sea surface.
This setup gained independence and began to stand out by analysts of the financial market as an independent a graphical model relatively recently (2011). Its developer, Scott Roots, is the author of several well-known harmonic patterns (Bat, Crab, etc.)
Externally, the Shark pattern is very similar to other harmonic patterns in the first place – a classic Double bottom, but there are a number of structural features, which provide uniqueness of this harmonic piece.
Like other trading system on the basis of harmonious setups, trade on the figure of the Shark, or rather a calculation of all basic parameters of trading operations is based on the Fibonacci levels.
The main difference from other Shark M or W models is that the structure of this figure the second peak have to be either above or below the first. This insignificant, at first glance, the structural feature of the model allows its developers to claim that a Shark is composed of two areas:
- the failed momentum of the trend;
- the strong backward movement.
And this division greatly enhances model-generated signals. It should be recognized that these statements have been repeatedly confirmed in practice. This setup has worked well as currency pairs and indices and futures. In addition, this model is of great interest from traders in binary options.
Set time periods are also unlimited. However, be aware that the larger the timeframe, the lower the relevance of the signals generated, and the smaller, the greater the number of false signals generated by this model.
Strategy trading pattern Shark
Like all the patterns Gartley, a Shark is not self-sufficient. In the sense that its signals cannot be considered as independent, as they require confirmation. One of the most significant and reliable and confirming signals can be called oscillator divergence with the price chart. Strategy of trading pattern Shark same all trading systems based on harmonic patterns.
The previously mentioned symmetrical price movement of trading instrument that underlies all available harmonic models, allows a high degree of accuracy to predict future price shopping tool.
For successful trading on harmonic patterns is very important is proper management of your capital. The correct definition of the pattern on the chart, and calculating its key levels give quite accurate and, very importantly – time to make deals. Even setting the take profit appear to be the right approach simple. But as to the insurance risks and minimize losses you need to apply reliable and proven on a specific trading tools, trend indicators.