
The pattern inside bar as a figure outside bar rightfully deserve the title the most controversial. In fairness it should be noted that these candle patterns do not carry any self-contained information. For example, on a normal chart pattern, inside bar can look the base of the Flag, a Pennant and a pair of three other figures of graphical analysis.

But once inside bar Forex and his alter-ego has received a separate place in the list of analytical tools in the Forex market, we should talk about them in more detail.
Outside bar: the patterning
Both of the considered pattern are among the strong signals. They are easily and unambiguously identified at any charts, but most visible on candlestick chart.
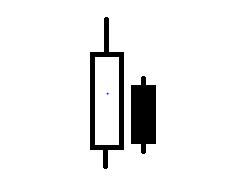
Inside bar pattern consists of two candlesticks, the first of which (the parent) completely engulfs the second or, in other words, the second candle is inside the first. The emergence of such figures on the chart suggests that the momentum of the current trend has run out (or severely weakened). But to relate this model to the family of rotary it is impossible. One should not see in these figures are harbingers of the lateral movement of prices.
Inside bar only says that the market established a balance, but the reasons of occurrence of such situation, and especially about its development pattern does not allow to judge. Price consolidation often occurs in anticipation of important economic news, or important technical levels.
And if in the first case, we can safely say at least a significant correction in the second high probability of breakdown of resistance and continue the trend. With confidence we can say only that after the appearance of the inside bar (especially a series of such patterns), we should expect significant price movements.
The strength of this pattern depends on many factors, the main ones include the following:
- the relative sizes of the candles. The greater the difference, the more noteworthy pattern;
- the proximity of the powerful levels of support or resistance;
- the time of important news release.
Inside bar strategy trade
Internal and external bar are widely used by supporters of indicator-free trading. However, even the famous authors found the definition of “inside bar Indicator”, although it is correct to call it “inside bar Price Action”.
This analytical tool is presented in the base configurations all the popular trading platforms. But even if it is not installed, free download indicator inside bar with any specialized resource.
As already mentioned, the data patterns do not generate a self-sufficient trading signals. The appearance of Internal bar in any case can not be regarded as calling for the conclusion of the transaction. His appearance is the signal for a detailed analysis of the market situation. But despite this trading system based on pattern exists and when used properly can provide a trader with stable income.
With a strong desire to find a similarity of this system with a known trading strategy Lazy trader.
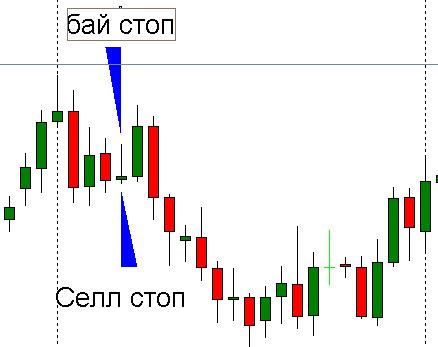
Once formed the second candle set two stop orders buy and sell. Level for Buy order is the high of the second candle, for the Sell –at least.
As stop loss levels are used the opposite of the second candle of the pattern, but it largely depends on the psychological characteristics of the trader and his financial capabilities.
With take profit, the situation is more complicated. As already mentioned, the pattern inside bar gives no information about the further behavior of the market and the trader must use other analytical tools. In particular, the exponential moving averages. In the literature often authoritative opinions, the authors argue that the price chart, beyond the second candle, will definitely work in this direction a distance of not less than the second candle.
There is another approach to implement this strategy. It lies in the fact that the transaction is in the market at the time of release the price curve beyond the second candle. Stop loss in this case is also installed on the opposite border of the second candle. TP (pre) is set at a distance equal to the length of the second candle. This approach is more aggressive and requires the trader detailed analysis of the market situation.
Conclusion
Both strategies have the right to life, but we must not forget that the Internal bar represents the unstable situation on the market.
Therefore, trading with the inside bar, we must not forget that for this pattern is characterized by a large number of false signals (example shown in the figure). To be defined in a similar situation can help indicator about the breakout of an inside bar, but he (like most indicators Price Action), for the most part only records a fait accompli, and no sign of it.
To minimize losses the trader will help clear follow simple instructions, the main of which can be called a ban on trade against the trend. Ie if the price chart breaks through the border of the inside bar in the direction opposite to the preceding trend, then the probability that this breakdown about a very, very high. Of course, “scalpers-extreme” in this situation will try to “catch the wave”, but calm and calculating traders, it is best to “sit on the fence”.