
Chart patterns on Forex represent powerful analytical toolswith which the trader can easily receive the necessary information about the market state and prospects of further development of this situation.

Graphical models Forex visual and don’t require from the trader additional mathematical investigations. Candlestick patterns in Forex, in terms of clarity, superior to the conventional patterns in the Forex market, but to this rule there are exceptions.
Chart pattern Forex OVER & UNDER
Reversal patterns in Forex, which include the model, relatively easily determined on the market. Although popular candlestick pattern in Forex for this pattern are less informative than line chart.
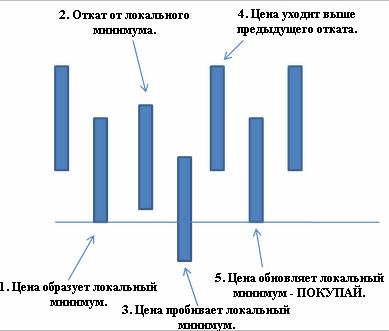
The conditions of formation of the pattern on the chart can be described as follows:
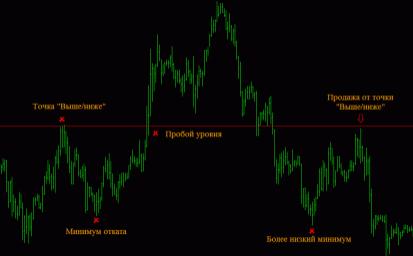
- After the next wave of the downtrend, the market adjusted, but the trend continues and the price successfully tests the support level, forming another descending wave. Following this powerful correction (the signal candle) easily passes the level of the previous correction.
- The horizontal line drawn at the minimum of the downward wave prior to the first correction is a strong level of support and is actively used by traders in the various trading systems. This is the algorithm of formation of a bullish figure. The bearish pattern is formed when opposite conditions.
Strategy pattern in Forex
Candlestick patterns in Forex, in any case, most of these models provides a good Foundation for the development of trading strategies. Reversal patterns cause the development of trading systems special interest. Timely and accurately a certain reversal of the trend offers big profits to the trader.
Of course, that the degree of such strategies is very high, because the turning pieces and the pattern under consideration is no exception, generating a large number of false signals. But here it should be noted that the accuracy of the signal depends largely on the chosen for the analysis time period.
OVER & UNDER is designed for a daily chart. Many experts say that it is no less effective and on the hourly chart, but, as practice shows, on intraday charts the percentage of false positives increases in direct proportion to the reduction of the time-frame. To use this model for long-term trading is impractical because on the weekly or monthly charts, the relevance of the signal is reduced to zero.
Necessary tools
Indicators patterns Forex, developed on the basis of this model, built on limit orders. Tuning the EA, the trader must specify the maximum distance of the entry point from the fixed pattern of resistance/support.
Alternatively the Fibonacci numbers in the same trading systems can be the MACD indicator, but it is not very appropriate alternative, since the MACD, which is based on moving averages are often late.
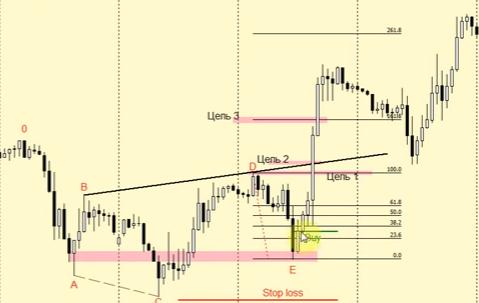
Similarly set the stop-loss – the user specifies in the settings its maximum distance from the point C (Fig.3)
Such a scenario has the right to life, but it can rightly be classified as aggressive and recommended for universal use, risky.
In a more peaceful option should wait for the demolition of the candle. This option promises an insignificant risk reduction with a slight decrease in the profitability of the operation.
With the definition of the level of profit to fix the situation is somewhat more complicated. Like most patterns of graphical analysis – OVER & UNDER is well defined entry points into the market and exit in the event of adverse developments. As for installation, take profit, indicator difficulties. You can certainly wait for the price chart, the point D (Fig.3), but this approach otherwise a waste to not be named.
To solve this problem, traders have to resort to using additional tools, the best of which are Fibonacci numbers. As shown in Fig.3., time-tested Fibonacci ratios allow a high degree of accuracy to determine the several objectives, among them the trader only needs to choose the most suitable one.