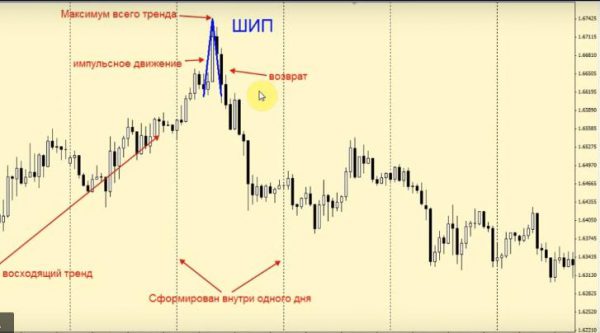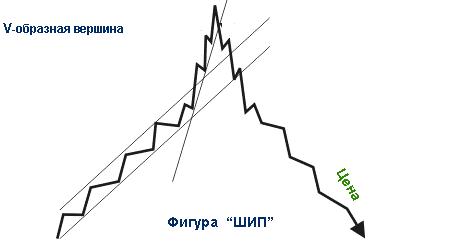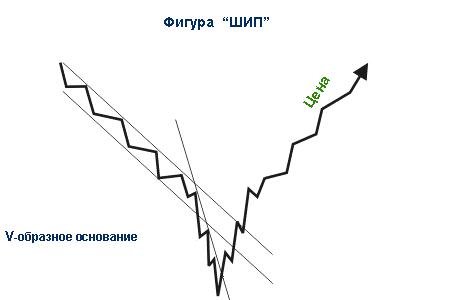
The figure of Spike on the Forex is not a popular tool of graphical analysis, but still quite effective in certain cases. It is advisable to use this element of graphical analysis on short time frames (H1, H4).

On large time frames the figure loses its relevance, and smaller significantly increases the probability of generation of false signals. This is a very controversial figure occurs on the chart, in periods of a versatile flat.
Thorn pattern on Forex
Reversal patterns, including Spike, in principle, are not sufficient indicators of technical analysis.

On their basis it is possible to prepare for the imminent turn of the trend to determine the entry point into the market, and especially to plan the financial result of the operation is very difficult. Therefore, reversal candlestick patterns often used by traders only as auxiliary signals to proven trading strategies.
The types of “spikes” and how they are defined
Reversal patterns candlestick Spike are of two types, each of which indicates change of trend from bullish to bearish and Vice versa:


For those patterns characterized by sharp changes in prices and technical analysis reversal patterns in this situation is also ineffective. Reversal candlestick pattern is present, as a rule, long candles. Accumulation of prices in these candles makes them unsuitable for analysis.
The figure of the Thorn in Forex is determined simply enough. Its appearance is always preceded by a sharp jump in prices in the direction of the trend, without intermediate corrections. As a rule, the price chart, at the last stage (before the turn) has large gaps (Gaps), which in itself is a strong signal for turning the trend (although Gaps can occur and before serious corrections)
After breaking an important resistance level, the price continues to move rapidly in the same direction, in this case the power of the pulse decreases, and the price is not less active pace moving backward. The depth of the breakout of the support level, as the depth of the correction will depend on many factors, most of which still should be called the prevailing market sentiment. In most cases, the occurrence of Spike pattern becomes a consequence of the fact that traders are overestimated or the potential price movement of trading instrument, or the importance of the expected economic news.
The ways to use Spike Pattern
As already mentioned, the figure of the Thorn difficult to use – the main problem is that signals from it are very controversial and require further confirmation.
However, for this figure there are some rules, compliance with which will allow the trader to achieve success. It should be noted that trade from thorn is a complicated process and not recommended for beginners.
A serious bid for success strategies based on reversal of the figures is correct and timely identification of these figures. At this stage it is very important to choose a time-frame. For different financial instruments it is different, but as a kind of averaged time frame you can accept H4. Even the most dynamic cross this gap disappeared hysterical, non-market factors and demonstrate the prevailing market trends.
The second important point is the definition of a trend and not its direction, and its presence as such. Trapped highly volatile sideways movement, the trader often takes the wrong decision about the existence of a trend. This error leads to the collapse of rare, but significant profit also does not promise.
Stop losses and take profits
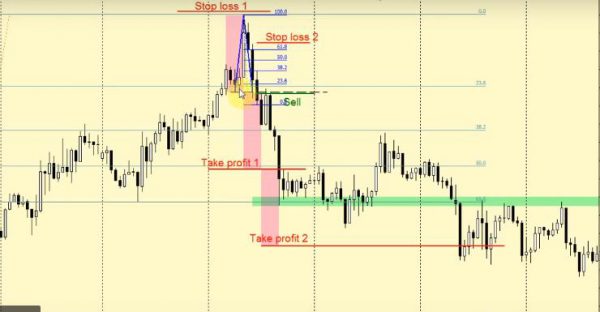
If the trend is in existence and identified his finishing spurt, which ended with a “thorn”, the case remained for small. Set a “stop” order of 30-50 points above or below the beginning of the “finishing spurt” – depending on the direction of the old trend.
When calculating stop loss should be based on the level of “thorn” was his breakout in the direction of the old trend is a clear indication that the market was not going to turn around, and just “shook off” the “extra” participants. As for profit, the starting point should be to take the size of the “final throws” of the old trend.

Conclusion
Transactions concluded on the basis of the reversal patterns (a pattern is a Spike, it concerns in the first place), require careful and competent management. We must not forget that these patterns are formed due to the sudden change of trading conditions, the consequences of which the market may experience some time (from 1 trading session to 1 week). Therefore, automatic manufacturing or trolling stops here is not recommended.