For the analysis of the price behavior are often continuation patterns that allow you to consistently make a profit through trade in accordance with the current trend. One of these figures – the pattern of the Canyon on the Forex, which is a fairly complex combination of multiple waves.

With sufficient training to learn how to identify the model and successfully use it to trade even a new trader.
How to detect a pattern on a real chart
Many technical Forex figures composed of a combination of a few candles or 1-2 pulses that appear on the chart as waves. Pattern Canyon arranged more difficult:

The model consists of the following elements:
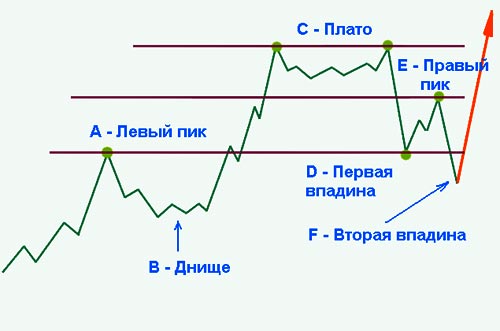
- In a bull market asset makes impulse movement in the continuing downward trend and reaches a local maximum – it is called left peak (point a).
- Then price goes into a correction and some time in a state of the flat, forming the bottom (In).
- After the asset rises much higher than peak A (2-3 times) and again adjusted, forming a plateau (C).
- Then there is the movement against-the-trend with a significant fall to about the level of the left peak. Formed the first trough (point D).
- Price makes another loop of the canyon, reaching a new record high – it’s called the right peak (point E). It is located generally midway between the plateau and the first cavity.
- Finally, achieved the second cavity of the canyon (point F), usually located just above the bottom of the V.
- After that, the asset continues its movement with the trend, making it possible to buy again.
It’s fun! The author, who discovered the pattern of price behavior on the basis of this figure on the chart Forex is Charles Henry Dow. This is one of the authors of the theory of the index of industrial production, which is known to the world as the Dow Jones.
Features of the canyon
Knowledge of the characteristics of this figure of the Forex market allow you to apply it to trade most successfully, and to weed out false signals:
- The pattern is formed very slowly, because it is not viewed for time frames below H4. Most often, the analysis considers daily and weekly intervals.
- The figure is formed only in a bull market, that is, the entrance is exclusively for the purchase.
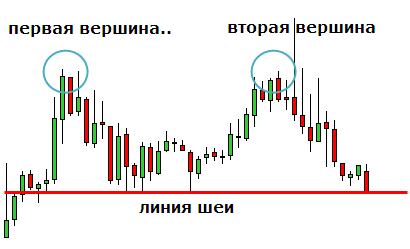
- The model can sometimes be confused with a double top chart, which is similar With part (plateau). However, the canyon is typical of the long-term development trend of large loops discussed above. At the same time double top contains only two points at the same level from which the price goes in the opposite direction. It can give short-term momentum down. The canyon gives the signal for a long continued trend.
- The canyon gives a more powerful signal, if the pulses of the movement of the trend start from the important support levels that have already been tested on history.
- To trade during important news release should not be, because the market can form a strong wave-like loops of the canyon, but they often give false signals to enter.

Trade on the basis of the pattern Canyon
Forex analysis of the trend continuation patterns allows us to determine the optimal entry point, stop loss and take profit. In the case of pattern Canyon trade rules:
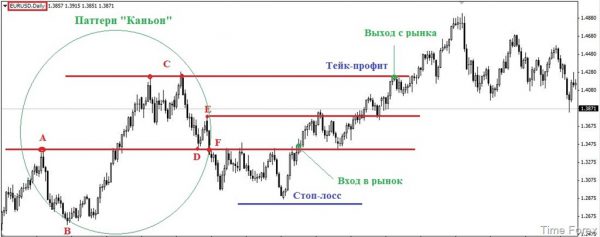
- The entrance is just after the final shaping. Price, having all of the described movements, should break through the line AF (the leftmost peak, the second depression).
- Stop loss is set at the local minimum, nearest to the place where the asset has broken AF.
- Take profit is set at the plateau lines S.

Often it is necessary to expect the formation of patterns over several days or even weeks. But the signals he gives are quite reliable. After a few movements against the trend, experiencing certain levels of support, the asset back on the established trend. The movement continues for several days, from which we can extract a good profit.
Such graphic figures of Forex, like the pattern of the Canyon appear on the chart are quite rare. However, this is one of the most reliable signals on which we can confidently predict trend continuation. So to learn how to trade using this model will be useful to both the experienced trader and the novice.
Additional continuation patterns presented in the video: