
Among reversal patterns one of the most characteristic and distinct is the figure of the rook on Forex. It is easy to determine even for the beginner and can be used as the basis of his trading system or in combination with other patterns.

Only a competent Forex analysis of the figures allows to select an established candlestick patterns that with high reliability predict a continuation of the current trend or shift.
The rook blue and red
Figures of technical analysis Forex that predict a change of trend, appear as bear and bull market. Depending on this, there are patterns of Red and Blue rook rook.
Red appears on the bullish trend and signals the emergence of a downward trend. Schematically, the figure on the chart Forex looks like a zigzag:
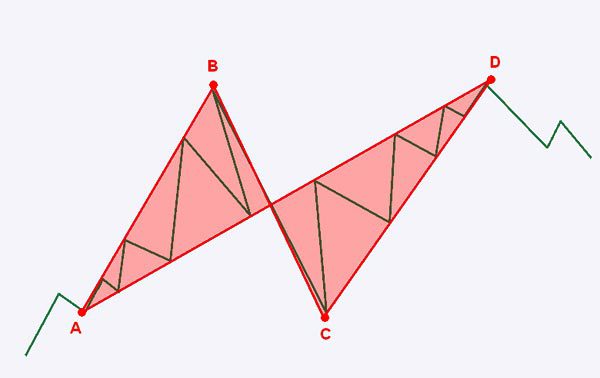
To describe the state of the market in the following way:
- There was a steady upward trend, which lasts from several hours to several days.
- At some point, the price makes a strong enough impulse to leap up, forming an expanding triangle (line AB).
- After that it starts to noticeably adjusted, again practicing level which was at the time of the birth pulse (point C).
- The asset will then again breaks with the trend, making now an even stronger impetus for a fairly short period of time (line CD).
- Finally, reaching a local maximum, it rapidly goes down, forming a bearish candle with large body and short shadows.
Such figures of the Forex market sufficiently to make them easy to identify on any chart. In the case of a Blue rook, the description will mirror:
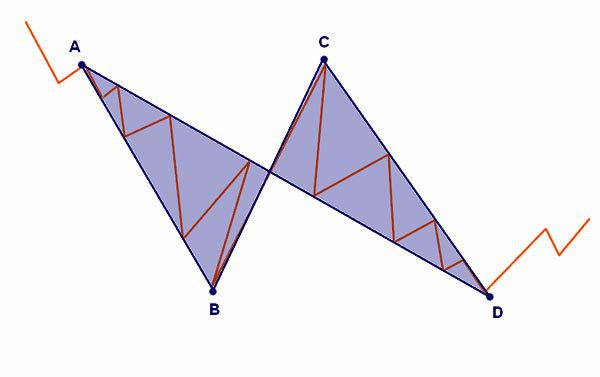
The figure got its name because it slightly resembles a flying rook:
- A – tail;
- In the legs of the bird;
- With the top of the head;
- D – beak.
The pattern reflects the mood of the players, is peculiar to the stage of completion of the trend. The market is still trying to follow the current trend. He takes one last drastic effort to maintain the position of dominant players. However, after 2 fairly bright pulses it becomes clear that efforts to preserve the trend is actually lost. The price rapidly goes in the opposite direction, allowing you to confidently collect from.
On a real chart these technical patterns Forex can look like this:
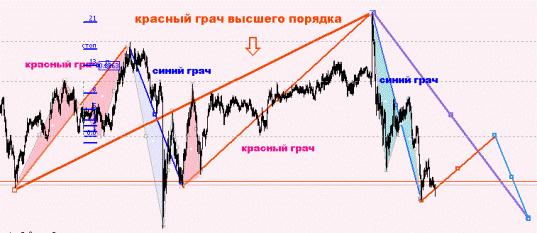
Here is shown sequentially alternating Blue and red rook that is often observed in the market. It is also seen that small rooks can be formed within a more global patterns, predicting the change of trend of a higher order.
That enhances the action figures
Graphic figures Forex are often used to trade not only as an independent signal, but in combination with signs that give the same tips. Thus, the effect of the pattern of the rook is enhanced if the following conditions are met:
- The longer exist on the market trend and the more he was expressed, the stronger the effect of the signal.
- The higher the timeframe, the more reliable the signal. Figure rook review at intervals of not less time.
- Figure rook is stronger if the trend reversal is derived from the price level that was successfully tested earlier price as support or resistance.
- For this pattern there is one more interesting thing: often the rooks are formed, following one after another. In this case, should be the line so that he stood a large figure, it gives the most reliable signal.
Tip! To trade by using this model during the release of important economic news and the first few hours after them is much riskier than to trade in Mednovosti period. The reason is that the economic indicators are fairly strong influence on price movement and it can often make sudden impulses in any direction, which visually will be very similar to rook. However, these signals are often false.
Trading strategy based on figure rook
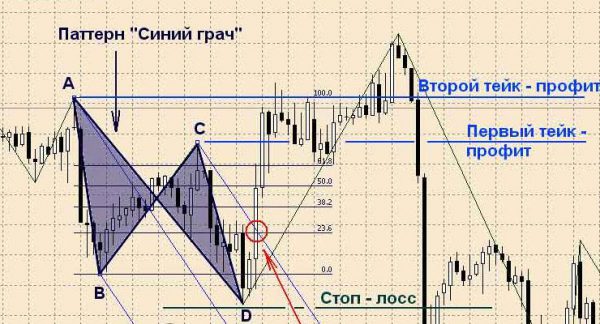
The use of this figure of the Forex technical analysis in real trading is based on the following rules:
- Market entry occurs only after the final formation of the model when the asset forms a large candle going in the opposite direction (shown by the red circle and arrow).
- Stop loss is fixed at the beak of a rook – point D.
- As for taking profits, you have two options when take profit can be put at the level of the top of the head of a bird (point) or by reaching the level at point A. If you put the Fibonacci lines, stretching them from A to D – it helps to visualize the pattern and levels of take profit.
Conclusion
Figure rook is one of the classic reversal patterns. She describes well the behavior of players at the end of the existence of weakening of the trend. The picture is just to give a visual indication on almost every chart, so the strategy has been used successfully by both professional traders and the beginners.