
Reversal patterns such as figure Diamond Forex different in that it is able to predict the beginning of a new trend of price movement in the very beginning of its inception.

All the figures of technical analysis Forex candlestick patterns, different combinations, different time of formation and many other parameters. However, in General, they can predict either a continuation of current market trend or a shift. This allows you to obtain the most advantageous point of entry into the market. Among these shapes, the Diamond occupies a special place. It is often called a diamond or rhombus.
How to determine the shape on the chart
This pattern is quite difficult to determine on the chart – it is more complex than a double/triple bottom or top, and looks different. Nevertheless, a few Forex figures in the technical analysis enjoy the same popularity like this. The figure of a Rhombus on the Forex market resembles a crown or a tiara, from whence he received the name. On a real chart, it looks like this:
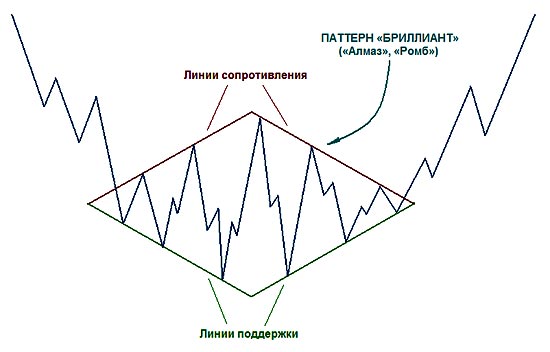
In this case, the figure of a Diamond on Forex was formed in a bear market and predicted the trend changing to the upside. The characteristic features of the pattern:
- For a long time in the market there was a current, pronounced trend: as a rule, within a few days.
- At some point, there is a long (typically many hours) correction of the prices for which the asset is testing different levels and returns from them in some boundaries of the corridor.
- Boundary correction are movable in nature and are clearly not close to any levels: first, they widen, then narrow.
- Finally, having different values within the corridor, the price breaks through the conditional boundaries of the rhombus (diamond) and goes in the opposite direction, making steady, progressive movement upwards.
In a bull market, the Diamond will look like a mirror:
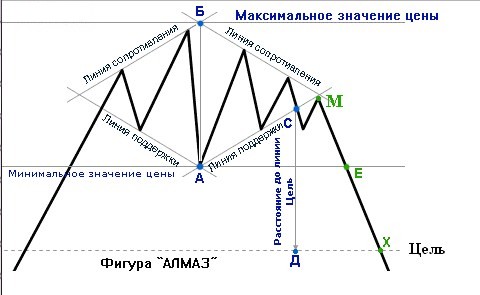
It is important to note one interesting feature of the pattern: the formation of the bullish trend occurs, as a rule, longer. The pattern is formed more volatile, i.e. has a large amplitude swing in comparison with that formed after a downward trend.
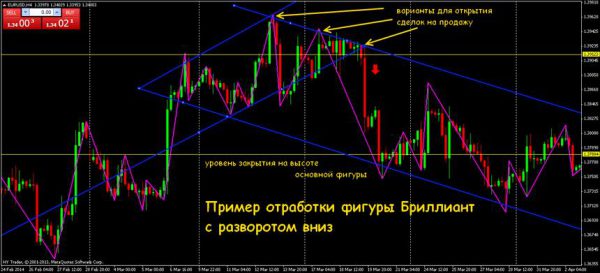
Tip! To reliably determine the formation of this pattern, it is necessary to lead direct lines through the highs and lows that have marked the price.
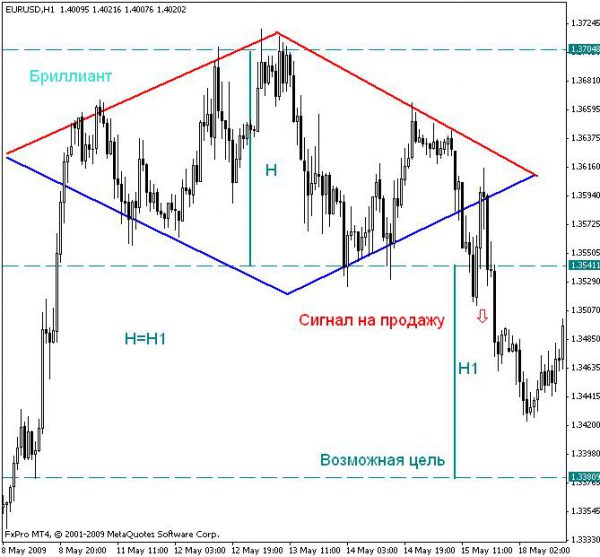
The entrance is at the breaking through these lines, as shown in the figure below:
What enhances the effect of the pattern
Reversal patterns in Forex can be used as independent signals. Often they are combined with additional signs (indicators, candlestick combinations) which confirm a change of the current trend. In the case of model Diamond these signs are:
- A pattern is formed on the higher timeframes (H4 and higher level). The older time interval, the more pronounced signs of reversal.
- The brighter was pronounced a trend and the longer he existed in the market, the stronger the effect of the pattern.
- If the candles break through one of the sides of a rhombus, formed large, with minor shading, it also increases the effect of the figure.
- Finally, if the highest/lowest bounce rates in the corridor correction coincided with important levels of support and resistance that have already been tested in the past, it also allows you to enter the market more confidently.
How to use the pattern in real trading
As figure Diamond Forex gives a fairly reliable reversal signal, then learn to identify it on the chart and apply in real trading it is advisable for every trader. In order to correctly apply the pattern, you need to consider a few rules on the fixing of the stop loss, take profit and the entry into the transaction:
- In the case of buying should wait for the final model generation after the cessation of the downtrend.
- According to numerous price fluctuations are the lines connecting the maximum and minimum points.
- To log on to purchase you need to get ready after the punched edge of the diamond candles with large bodies and small shadows.
- The entrance is when the price confidently crossed the line, the greatest deviations upward (as shown in the figure).
- Stop-loss should be set at the minimum price value in the diamond figure (lower cyan line).
- Target take profit is determined by the size of the maximum fluctuations in the diamond – exactly as it must go in the opposite direction (the upper cyan line).
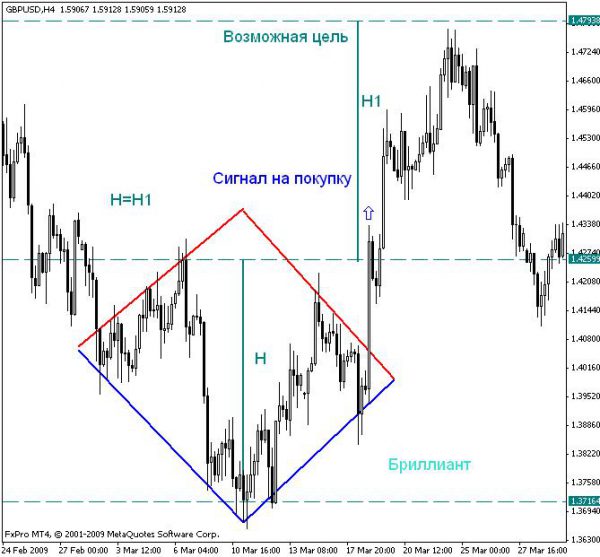
In the case of a change from an uptrend to a downtrend entry rules look mirror: they are schematically shown in the figure.
Conclusion
Technical figure a Diamond is one of the classic reversal patterns. It is almost always successfully worked through and gives reliable signals. Despite the fact that the pattern is formed quite a long time, it can be successfully use in their trading strategy.