Among reversal patterns Pattern Dragon on the Forex – one of the classic versions. Even the beginner will easily identify it on a real chart.

Some sources say that it is quite a rare pattern, and in the other – on the contrary. If you say sure, then this figure appears no less than all of the other reversal patterns, and it is only necessary carefully to evaluate the schedule in order to notice it.
How to see the figure on the chart
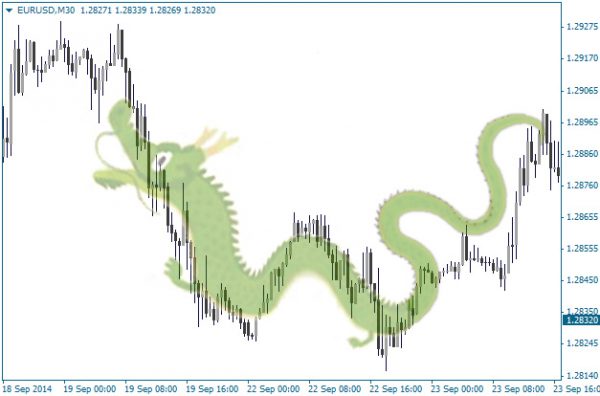
Pattern Dragon got its name due to some similarities with fairytale character: he also has a head, two legs, a tail and a hump on the back.
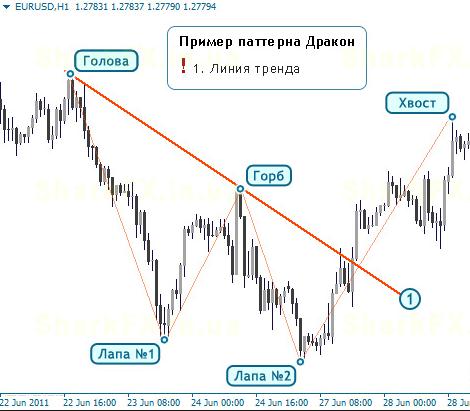
The figure is the figure Dragon Forex, resulting in a bear market. It consists of several elements:
- The head is a local maximum, from which the asset went in the direction of the trend.
- Hump – second local maximum, which together with the head forms a trend line 1.
- First leg – at least where the price has gone up to hump.
- The second leg – another minimum located slightly below the first legs. From it asset turned and broke through the trend line 1.
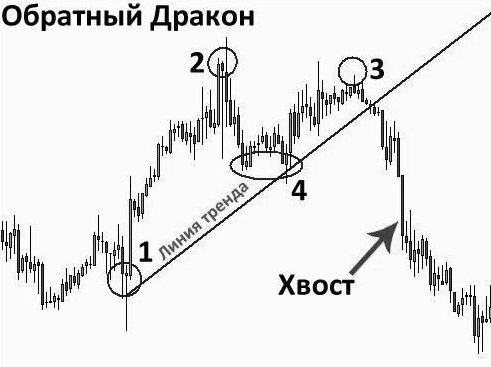
In a bull market, the dragon looks like a mirror – it is often called inverted or reverse:
The figure describes the mood of the market during a declining trend: first seen the classic trends with the update of local maximum/minimum (the hump), Price double tests maximum/minimum values (legs 1 and 2), and then turns around and actively moving in the direction of the new trend.
Reinforcement pattern
There are a few additional signals that confirm the trend reversal and enhance the pattern of the Dragon Forex:
- The ratio of the lengths of the legs of the dragon – if the second paw is longer, the confidence in the upcoming turn more.
- When the level of the second legs coincides with some important level of support/resistance has already been tested in the past, this also strengthens the pattern.
- The more pronounced the candles (large body with short shadows), pushed in the opposite direction after the formation of the second legs, the more confidently we can speak about the emergence of a new trend.
- The longer there is a prevailing trend, the more likely its end. Pattern of the Dragon is a 5 wave trend and in this case, the turn signal is most reliable.
The figure can be detected on virtually any timeframe, but it is safest to use it at intervals from the M30. On H4 and D1 it is formed very rarely. It is not recommended to trade in this model while waiting and the release of important economic news. At this time the market makes a random motion in both directions until further trend and pattern can give many false signals.
Dragon and double top/double bottom
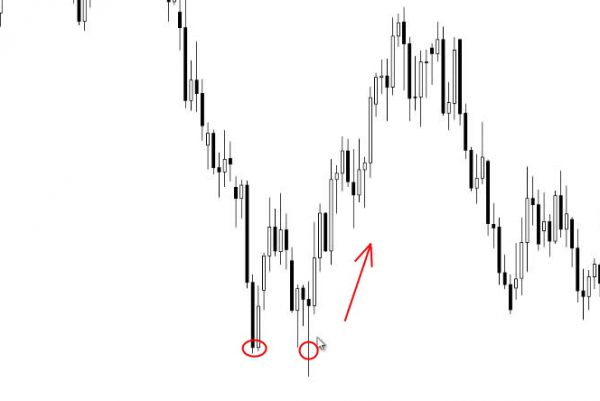
A cursory look figure easily confused with another famous model – double bottom:
Or confused upside-down dragon with a double top:
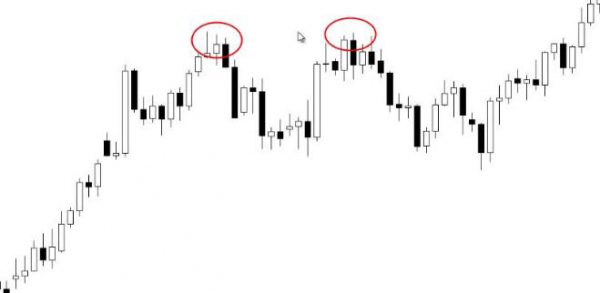
These models are also divergent. But fundamentally they differ from the considered pattern is the fact that a Dragon has 2 legs that are located at different price levels, while the top and bottom “I” in about the same line.
Trading strategy on the basis of figures of the Dragon
Application of the model in real trading is subject to several rules that allow the right to set a stop loss and take profit.
- Market entry is carried out only under the condition that the trend line (connects the head and the hump) punched candle going in the opposite direction.
- Stop loss is set according to the paw (in this case line 2), most often on the second.
- As for the take profit, the pattern of the dragon the purpose of closing different: the first is determined by a line of backs, the second – head.
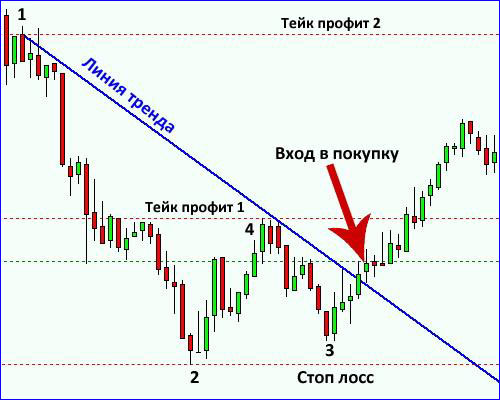
Often traders choose intermediate goals take profit: these are the levels where the price stayed, when he went between the head and the hump. For a more detailed analysis purposes the Fibonacci grid, which is stretched from the head to the biggest legs (usually two).
Conclusion
Although this pattern is formed on the market rarely, and on the daily and especially the weekly charts to see the real him luck, he gives reliable signals which are well practiced. Profits can be several times, depending on the dynamics of price movement. This explains why the pattern is one of the most popular reversal patterns on the market.