
Pattern Rectangle on Forex, which can occur in both bull and bear market, confirms that the price will continue in the same direction. Its fairly easy to identify on any chart thanks to a distinct resemblance to a rectangle.

Candlestick formations can be divided into 2 large groups – reversal and continuation patterns in Forex. The first advantage is that they help to identify the emergence of a new trend.
How to identify the model on the chart
Forex analysis of the figures shows that a strong combination that gives the most reliable signals for entry, are formed near important levels of support/resistance. These price values have already been tested in the past repeatedly and each time the price had gone from them in the appropriate direction. The rectangle refers to those patterns that reflect the movement of the asset between the local levels of support and resistance.
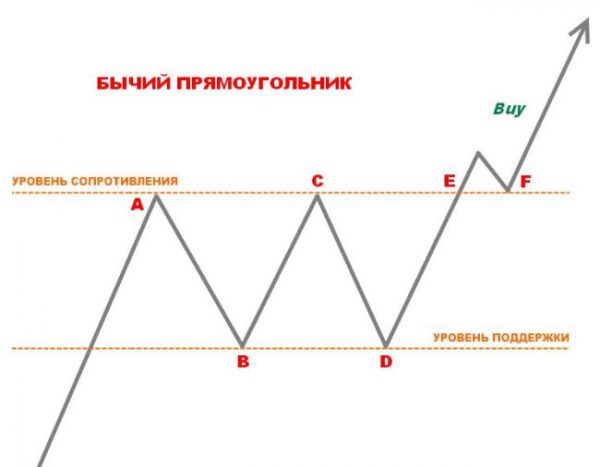
Description of the figure Forex in a bull market looks like this:
- There was a pronounced bullish trend lasting for a long period of time – from several hours to several days.
- During a certain period there is correction of prices in a corridor of approximately parallel lines. Asset a few times testing these values with the other side (points A, b, C, D).
- After another test an asset breaks through a resistance (point E) and goes further with the trend, most often making one small correction beyond the original corridor (F).
Accordingly, the figure on the chart Forex bear market looks mirror:
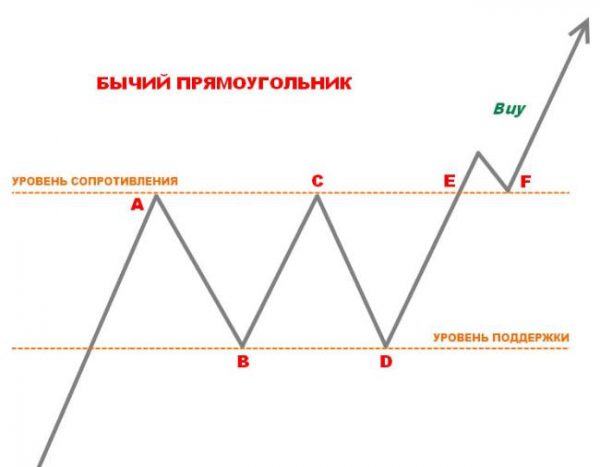
Such graphic figures Forex as a Rectangle, describe the state of uncertainty in a trending market. Initially, the prevailing trend is at the stage of correction. In fact, it’s flat on the market – it can last from several hours to several days. At this time there is the struggle of buyers and sellers, during which win one, then the other.
Finally, the market is determined by your preferences and the asset breaks through the local bounds of the rectangle. It continues its movement with the trend.
Peculiarities of the pattern Rectangle
Technical patterns Forex often obey the same laws and at the same time have a unique quality. Shape Rectangle has the following features:
- A rectangle is formed, if formed at least two peaks and two bottom approximately parallel to each other levels.
- Features bullish figures of Forex market is that the boundaries of its corridor in most cases more than the bear.
- While prices within the boundaries of the rectangle it is impossible to predict the behavior of prices, because the potential and its reversal. So the pattern is complete when price breaks through its boundary in the direction of the current trend.
- Such figures of technical analysis Forex, as a Rectangle, it makes sense to consider only in a trending market.
Reinforcing factors
Forex patterns of technical analysis are used separately or in combination with other signals (indicators, candlestick combinations). These signals can give more confidence to enter. In the case of the considered model, these include:
- The seniority of the timeframe the more reliable signals come from the 4-hour interval and above.
- Duration of formation of the rectangle – the longer the price went in the hallway, the stronger will be the movement after overcoming its boundaries.
- The more body candles that made the breakthrough of the border, the stronger the entry signal.
Important! It is not recommended to use a pattern in anticipation of and while receiving important economic news. At this time the market shows strong response rates, however, most often it is short. We should wait until the players again will determine further trend.
Trade on the basis of the pattern Rectangle
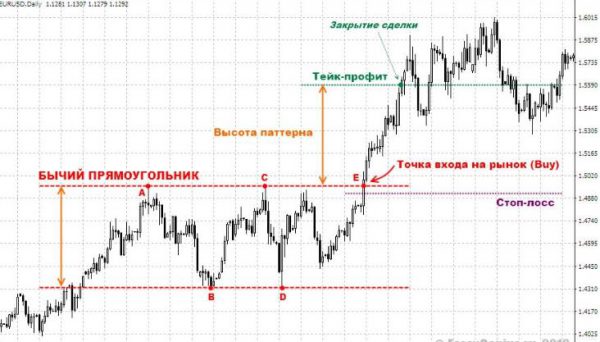
Rules of entry to the market based on this strategy are shown in the diagram (for example – bullish rectangle):
- The entrance is just after a reliable break-through asset support line (point E).
- Stop-loss is placed on the support line, after which it can be moved up to the resistance level.
- Take profit is set based on what the price will be distance at least equal to the width of the rectangle.
The results
Considered pattern is quite easy to see on the market even a novice trader. The rules of this strategy is also easy to understand. Despite the fact that the figure is formed long enough, it gives strong signals for entry and when used correctly can bring a stable profit.