
The patterns of Price Action include a reversal of trend on the Forex and the figures continue the existing trend. A clear signal of reversal is the Figure Triple top/Triple bottom Forex.

Usually prefers to move relative to the trend, and not to turn around, so to practice with reversal patterns is not easy. But the ability to see the emerging trend allows you to decent profit.
How to see the pattern on a real chart
The model name fully reflects its essence: at the current trend the price 3 times trying to break a certain level but goes in the opposite direction – then enter the market.
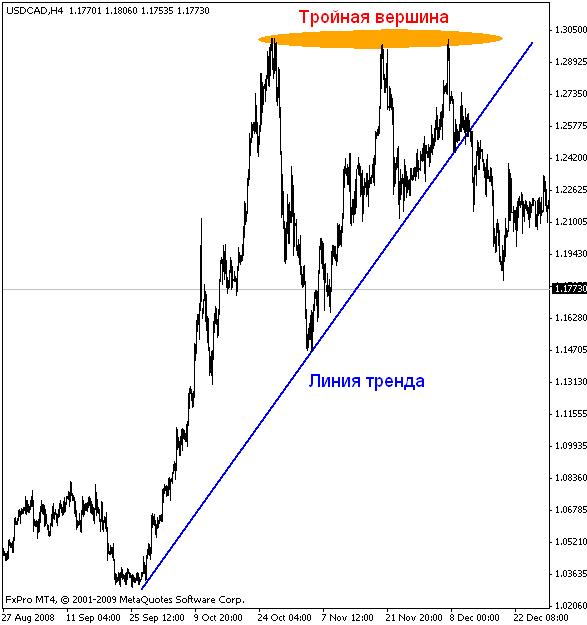
Signs of a pattern:
- Long-existing upward trend.
- Local lateral movement with 3 attempts to test a certain level.
- The resistance line completely or almost completely horizontal.
- After threefold attempts to break through the line of the asset goes in the opposite direction, forming a series of large candles of the corresponding color.
The signal is formed for a long time, but it is a strong sign of a reversal, because the test level is 3 times.
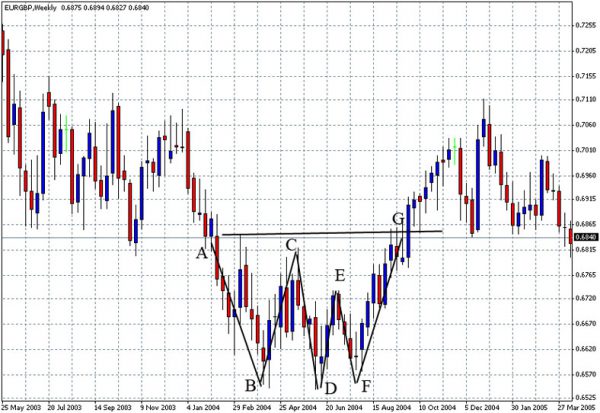
At point A the asset is included in the correction area, trying three times (B, D, F) to break a certain level, which lies almost on the same line. Bounces occur within the neck G of a point (C, E). After the last failed attempt, the asset sharply gains strength and goes up and break the neck line.
Triple top and rectangle
Even experienced traders, knowing and successfully using patterns, Price Action, can make a mistake, because triple top in technical analysis visually similar to a different model – a rectangle.
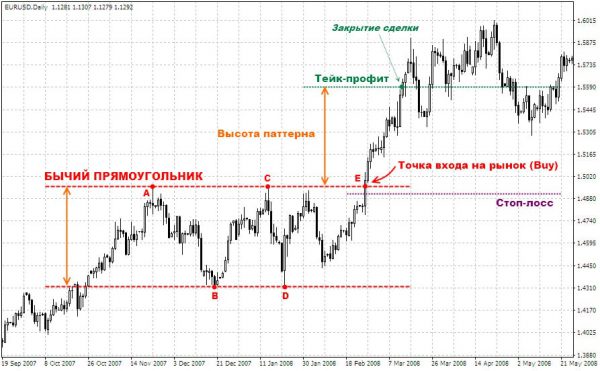
A rectangle is also formed in a trending market the price touches its borders on top and bottom several times. How to distinguish a rectangle from the triple top? In the first case the price continues to move with the trend, and the second asset is unfolding rapidly going down.
What enhances the effects of signal
Candlestick reversal patterns of trend are often used as independent signals. Often they are used together with additional signals, allowing to enter the market more confidently:
- Level, test asset is very strong and has repeatedly tested becomes a support line, resistance line. Levels with round values (0,6500, at 1.1500, etc.) are considered to be more psychologically strong.
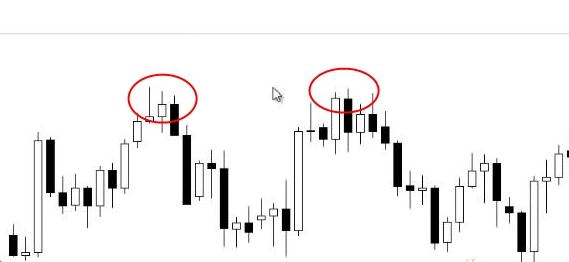
- Where you touch the lines represent a local reversal pattern – for example, Rails.
- After the third attempt to break the asset goes in the opposite direction, forming a large candle. The more – the stronger the signal.
- The pattern formed after a pronounced and long-lasting trend.
- The higher the timeframe, which formed a reversal pattern, the stronger its effect. To consider Triple bottom/Triple top at intervals below the time is not recommended because the younger time frames usually give a lot of false entry signals.
Triple bottom and Triple top in technical analysis not recommended for use in the following cases:
- While waiting, and the release of important economic news – the market is swinging and unpredictable.
- During a long float, when the players have not yet decided on the direction – reversal patterns are only applicable in a trending market.
How to apply a figure in real trading
To successfully use the pattern in the trading system, you need to follow a few simple rules:
- Enter the market only after prices triple-checked the level and started to leave him a large candle in the opposite direction.
- Stop loss is placed on the test line.
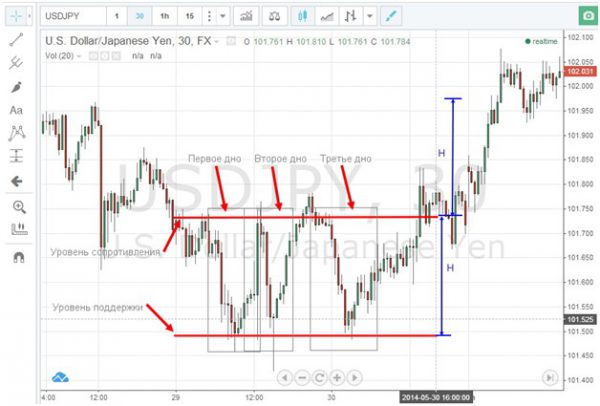
- The take profit are set based on expectations that the price will cover the distance (blue line, N) is equal to the gap between the levels of support and resistance (red lines).
Conclusion
This model is formed on the chart rare, but serves as a reliable signal for a more confident entrance. So competent trader need to learn this pattern and be able to use them on occasion.