Figure Double top/Double bottom Forex – classic and time-tested pattern.Each trader must be able to predict the weakening of the current trend with a further change of direction of the price movement.

Most reliable signals that allow to correctly assess the situation on the market, can be obtained by analysis of candlestick combinations on the chart.
How to define a pattern on a real chart
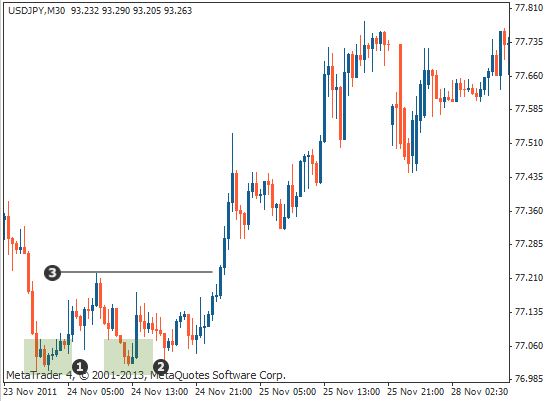
The figures of trend reversal on Forex are relatively rare, but you can get the maximum profit at the expense of the earliest entry in a transaction – at the time of the birth of a trend. Knowing how the figure looks like a Double bottom on a real chart – easily determine the most profitable entry points:

In the chart there are two key points:
- The first floor (1), which is a test asset to a certain level – then it goes to above line 3.
- Second floor (2) located at the same level. Asset re-testing a value and a result of the emerging bullish momentum, expressed by the large candles of the appropriate color with a slight shadow.
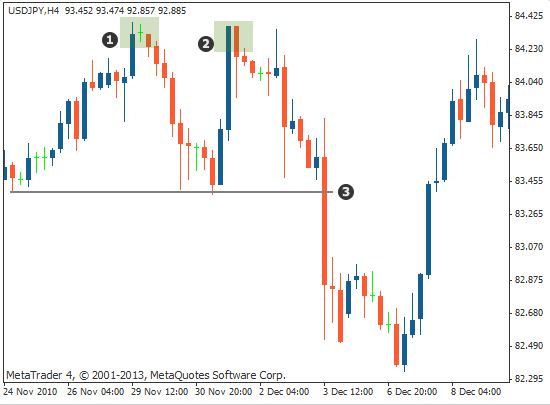
Such market sentiment is an attempt by the bears to lower the price of (1), (2) that fails – the bulls win, breaking through the line 3. Double top chart the graph looks like a mirror:

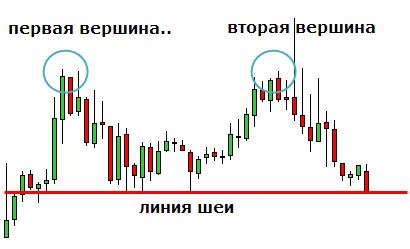
The bulls are trying to raise quotes (1) and (2), but could not breakout takes place line (3) (neck) – similar to the pattern Head and Shoulders.
What amplifies the signal to the input
Figure Double top and Double bottom in a trending market is a reflection of failed attempts temporarily dominant player to direct the price in a certain direction. To more confidently enter the market have to consider several additional conditions that make such patterns of reversal, the trend is stronger:
- The level of support/resistance, double-tested asset is historically strong – in other words, price has repeatedly come to the line in the near past.
- While trying test this level the asset leaves him back large bearish/bullish candle and break the line (3) is fast and confident.
- Candles at the test level, form a local reversal patterns, for example, the pattern of Rails – two identical candles of different directions, standing almost level.
- The higher the timeframe, the longer and stronger the effect of the pattern, but it is not recommended to consider the model at intervals of time below.

Often the figure of the Double top/Double bottom Forex works reliably:
- It is not necessary to search for a pattern on range market when you exit the narrow corridor, the players are often unable certainly to determine the dominant dynamics.
- During important economic announcements, the market might react very impulsive and form 2-3 pattern such that it is better to ignore.
How to apply patterns in the trading system
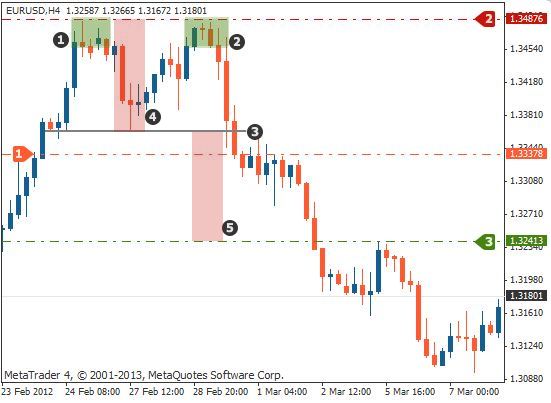
The figure of the Double bottom technical analysis is used along with a Double top. These reliable reversal patterns can be used separately or in combination with other models and indicators. To correctly enter the market, you need to know about the moment of entry, stop loss and take profit. Rules on the example of double top:
- The entrance to the market for sale only after the final formation of a pattern (a breakthrough price neck line 3).
- Stop loss is set at the resistance level (red line 2), which has twice tested price (points 1 and 2).
- Take profit (green line 3) is placed at a distance at least equal to the path of the asset between the neck (3) and the vertex level (1) and (2). Typically, the asset goes on, so you can enter multiple orders, following the rules of risk management.

The results
Reliable reversal patterns are formed slowly and appear on the market less than a signal to continue the trend, but all the same should learn to identify them and apply in real trading. Thanks to them you can see the market trend is just at its embryonic stage and get the maximum profit.