Among reversal patterns Figure Head and shoulders Forex pattern is a classic, which still has not lost its effectiveness.
It is easy to identify on different time frames and apply either as a separate signal or combined with other signs of trend change.
How to define a pattern on a real chart
Schematically on a graph model similar to the image of the head (the great wave) with two shoulders (two smaller waves, approximately the same size). With the change of bullish trend to bearish figure head and shoulders as follows:
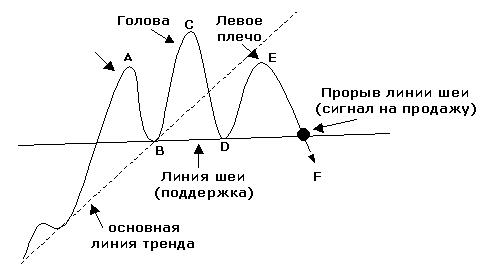
The dynamics of the market looks like this:
- Price makes a local maximum in the form of a quick spike (point a) – the first (left) shoulder.
- Is adjusted to a certain level (point b) and again breaks up.
- There is more significant price momentum (point) – usually 1.5-2 times more than the previous. Then the head emerges.
- Her price is adjusted again, coming down to the line (point D) education of the left shoulder.
- Then going up again, but not so high (point E) to a second (right) shoulder. The support line looks like a “neck”.
- Only the price breaks through the support line (point F), the pattern is formed and is a signal to sell.
In an uptrend the figure of a Head and Shoulders indicates its termination, a break of the support line – heralds the emergence of a bearish trend. For a long period of falling prices produces the opposite effect:
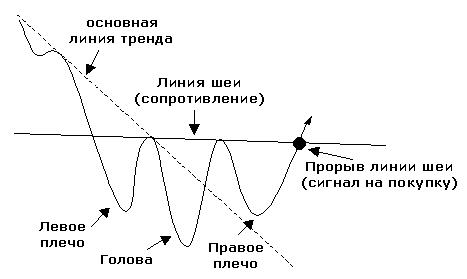
Figure inverted Head and Shoulders suggests that the bullish trend that prevailed on the eve of losing power. So after breaking the resistance line begins to emerge a rising trend.
That enhances the action figures
In the real market the figure is not so perfect – the size and shape of the shoulders are different. Line of support/resistance is not always horizontal – inclined often goes up or down.
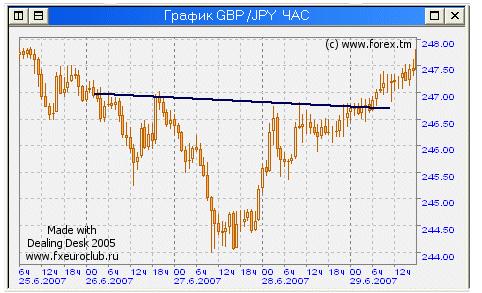
Moments that make the pattern harder:
- Head is always much more pronounced and the shoulders (a big wave with a distinct peak or a valley).
- Head-and-Shoulders is a reversal pattern that appears on the existing trends. The duration and severity of the trend, respectively, amplifies the signal.
- Possible to enter the market, if the pattern formed near important price levels, support/resistance, which is tested price.
- If the candles through the line of support/resistance after the formation of the right shoulder – with large bodies and small shadows, we can confidently make the entrance.
- If from the left shoulder to the head (any trend) of trade volumes decrease, and from the head to the right shoulder increase is a clear signal to enter.
How to use the pattern in real trading
The correct application of the reversal Head and Shoulders on different trends imply certain rules:
- The pattern slowly formed, therefore, be considered only in senior temprano (not less time) is on the smaller intervals present information noise, often forming false signals.
- Head-Shoulders – the figure Forex work well in the absence of significant economic news. In anticipation of the news release and immediately after its publication, the market is able to make a lot of impulse movements in different directions, which causes false signals to enter.
- With regards to specific points of market entry: it is preferable to choose after the complete formation of the pattern, when the price clearly broke through the line of support/resistance large candles (line 1 on chart below).
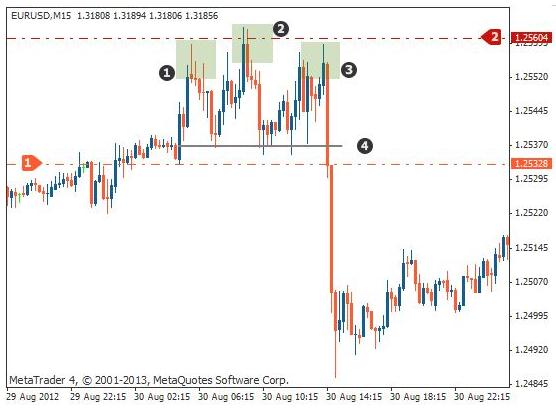
Black numerals marked with:
- 1 – left shoulder;
- 2 – head;
- 3 – right shoulder;
- 4 – the support line after the breakout which are on sale.
Stop loss is line 2 (red in the figure), and TP is the distance between the neck (orange line 1) to the highest point of the head (red line 2). It is assumed that this minimum passage distance of prices in the direction of the new trend. Often the distance is longer, so it all depends on individual strategy, and patience of each trader.
Conclusion
Figure Head and Shoulders in technical analysis – independent setup and refers to the patterns of indicator-free strategy Price Action. But, experienced traders often use it in combination with indicators (e.g., volumes) or with other models on the chart.