
To Forex analysis of the figures give the most reliable signals for market entry, often use additional tools. For example, pattern bow Tie on Forex is determined by use of indicator moving averages with different periods.

The advantage of this model is that it gives an unambiguous, easily identifiable signal to enter the market.
How to detect the pattern on the chart
Figure butterfly Forex is easy to define additional indicators that should be applied to the chart. In the appropriate section, choose “Moving Average” and apply three such lines with settings:
- a period of 10 to Simple.
- the 20 period Exponential;
- the 30 period Exponential.
Then you need to look for signals when all three lines will intersect at one point, and the trend reverse. Schematically, it looks like.
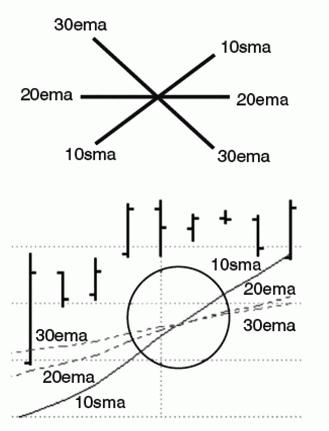
It is best to create the moving lines of different colors – then see the pattern very simple.
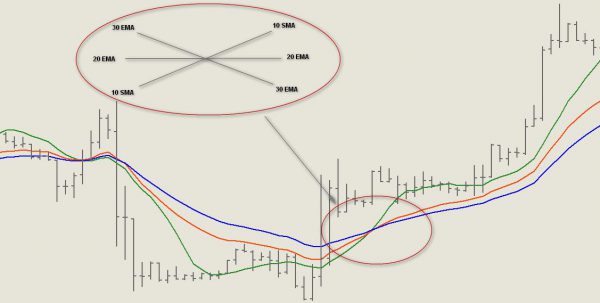
Market entry is carried out in the case when these lines are crossed as shown in the figure. Thus it is necessary to wait for the first retracement, which will update the local minimum/maximum.
Since the appearance of this figure technical analysis Forex reminiscent of the tie, it was called the Butterfly Pattern. It is a reversal pattern that appears on the bearish or bullish market.
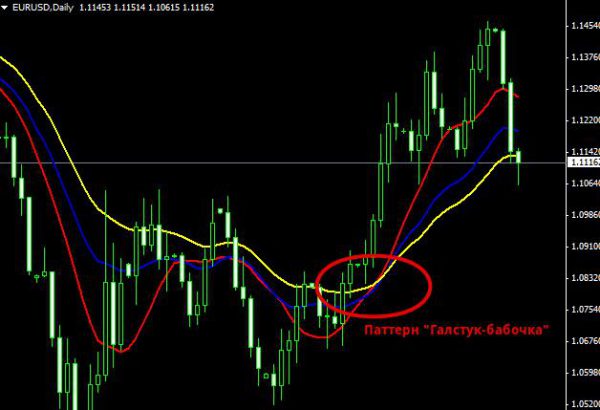
There are a few features of its use in trade, which provide more reliable signals for transactions.
Features of the application pattern
Pattern bow Tie can be used based on several features:
- The model should be considered only in a trending market. The more lasted an existing trend and the stronger is the trend, the stronger is the reversal signal.
- The figure applies only on senior time frames, from 4 hours.
- During the release of important economic news, and in the first hours after they occur, with instability in the market – further movement is difficult to predict. At this point the Butterfly can give a false signal.
- The reversal of the trend should always be confirmed with the corresponding candles with big bodies in succession in the new direction.
- Finally, if the trend reversal is accompanied by other symptoms, it enhances the effect of the pattern. Such characteristics include the reversal of other figures of graphical analysis of Forex signals from the indicators.
Trading rules using the pattern
The pattern is formed quite a long time. Usually it takes a few days or weeks. This is necessary in order to have it fully formed and a trend reversal has received confirmation of the actual price movement.
The trading strategy contains the following rules:
- The entrance is on the first correction, when the three moving averages have crossed. The first bar, which will form the pullback is the signal. It can get very close with the lines or even touch them.
- The stop loss level is set at the value prices, which it acquired at the intersection of three moving averages to each other. In the future it may rise to the level of the first correction.
- The profit is taken out of the market at the time when the scrapping of the current trend and the asset breaks all three moving averages. All the lines converge at this almost one. The level of take profit in this case is subjective because the trend movement is usually within a few days. Often the cessation of a trend is accompanied by the formation of a new Pattern bow Tie, and then you can prepare for entrance into a new trend.
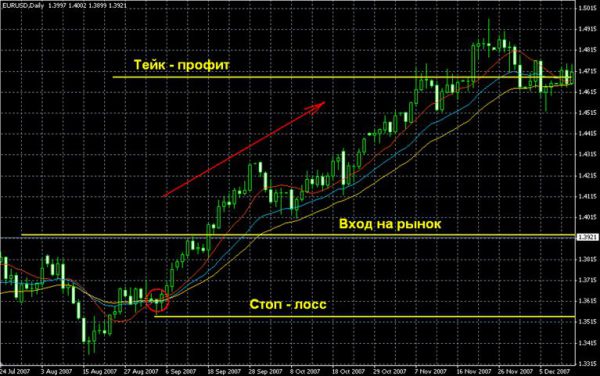
Important! In the case when the price returns to the moving average and goes against the direction of the transaction, we need to reassess the situation.
The market gives you the opportunity to make a deal at a better price, as shown on the chart:
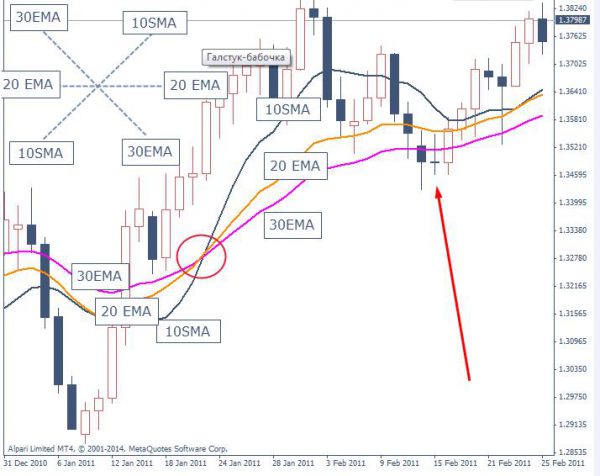
To determine the pattern of the bow Tie chart is easy. It gives unambiguous signals and in case of confirmation of the trend reversal you can get a good profit. The only disadvantage of this model is its long formation. It is best to search for a pattern on the daily charts, where you can find the most reliable signals.