Shapes Hammer and Hanging man, and many other technical patterns Forex, are very popular among currency traders. The main reason for this popularity is the self-sufficiency of these figures.

Graphic figures of the Forex market, the vast majority are trend or counter-trend, i.e. signaling the sentiment prevailing in the market.
Description of the pattern
A pattern the Hammer and the Hanging man figure have exactly the same appearance, but are formed in opposite relation to the market situations and accordingly form the different direction signals.
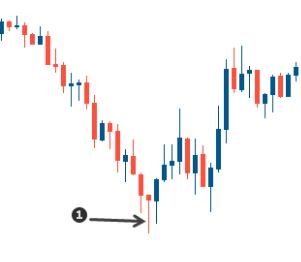
Considering the figures of the Forex market are reversible, for example, figure Hammer announces the completion of the “bear” trend.

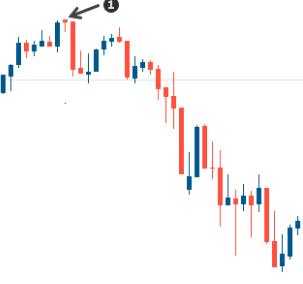
The figure of the hanged man is the last candlestick bullish trend. Both figures have a short body and long (not less than three times the length of the body) candle. The top candle is missing.

Both figures have to be considered in the medium-term trade (D, W).
The philosophy of the formation of figures of Hammer and Hanging man
The Hammer pattern is formed when a downtrend. Bearish sentiment still prevail, but market potential is almost exhausted. In the course of a day or other period of time the bears tried to overcome powerful resistance, but their attempts were not crowned with success. Increasing the pressure of the “bulls” gave rise to a deep correction, which alternated with the next attempt “bears” to take the turn, and gave rise to long shadows on the signal candle.
The unwillingness of the market to move down, forcing the bears to take profits and exit the market. The process is usually difficult and the candle has not time to fill up significantly before the end of the trading session. It is obvious that such a confrontation is accompanied by high volatility. So use this pattern for time frames less than P4 is very risky.
The philosophy of “the Hanged man” are identical, but it formed a bullish market. Similarly, leaning to the ceiling trinoc, trying to pass it to target new frontiers, but the resistance is too powerful and most prudent traders to reduce long positions, the weakening bullish pressure. Thus not breaking the coveted milestone, the market begins to slide down, forming the “head hanging”
Candle Hanging man, due to the above reasons, in its pure form (i.e. without top candle) is very rare and usually has a small upper shadow. Not devoid of this sin and the figure of the Hammer Japanese candlesticks. The reason for this, usually are hot and impatient supporters contrarreloj trade, which always impose significant levels of resistance with limit orders with tight stop-loss. Mass to trigger these stop losses creates additional chaos in the market.
Trade the patterns the Hanging man and Hammer
As already mentioned, these candles are self-sufficient figures of technical analysis and trading strategy based on them is quite simple. Waiting for a formed candle with a long lower shadow and has no upper shadow, it is safe to enter the market, because there is every reason to believe that the market will turn in the opposite direction.
Buying and selling:
- Buying a trading instrument (in the presence of the “Hammer”) can be performed with the aid of a stop order, which is set 5-10 points above the top point of the body of the signal candle – this takes into account the spread of your broker. Stop loss should be below the body. Accurate calculation of the level of take profit in this situation is impossible, but, as practice shows, at the stage of nucleation of a new trend, the market is at a distance of not less than the length of the signal candle along with shadows. Ie even if the new trend does not have the powerful potential of the “bulls” to compensate their losses incurred during the “border battles”.
- After the “Hanging man” selling the trading instrument is done manually. Stop loss is placed at 15-20 pips above the upper point of the signal candle and take profit can be set at the bottom point of the shadow. This is a very conservative approach. As a rule, trading on this strategy “bears” are not used in the initial phase TP, and the bottom point of the shadow is used as the trigger level, tralling stop.
Advantages and disadvantages
Among the advantages of rotary figures can be attributed to their simplicity. Formed in a relatively short time range they represent a powerful, proven repeatedly practice trading signal. They are easy to recognize and they do not have other options of interpretation.
Figure Hammer in candlestick analysis, for all its self-sufficiency remains a trending pattern and does not allow to clearly define the market potential.