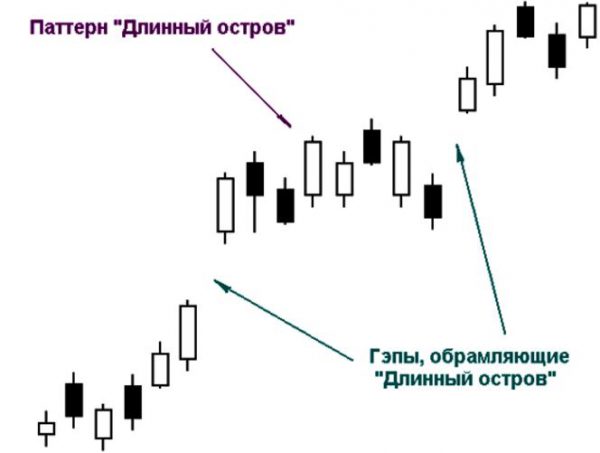
Technical patterns Forex, for example, Pattern a Long island Forex are prominent in training programs for traders. This family of analytic tools, diverse and numerous. No sense in even trying to study all the figures of technical analysis Forex – especially since their list is constantly updated. Most of these figures effective on a short term basis and is used solely for speculative trading.

But there are graphic figures of Forex, which should be attributed to strategic tools. They are effective in the long run and used, as a rule, investors and large traders. One of these figures is a pattern with the romantic name “Long Island” or “Long island”.
“Long island”: formation
Patterns of technical analysis, especially candle patterns Forex, which include “the Island” is not always easy to recognize on the chart. The pattern of “Island” is almost devoid of this shortcoming. In the simplest wording of his description can be summarized as follows – “part of the schedule is bounded on both sides by Gaps”.

To be able to assert with confidence that “we on the island”, is required to identify the following mandatory features:
- Gaps should be broad and flat and located at different levels;
- U-shaped graph of the market volume of transactions on the trading instrument;
- For analysis you should choose time intervals of 2-3 months (the time frame D1). All figures of graphical analysis of Forex (no exceptions) most effective at certain time intervals. Here and “the island”, though called “long”, but at too long the intervals of its information content drops sharply.
At short intervals this pattern is not used, like other trending candlesticks in Forex.
“Island” strategy
As already mentioned, the strategy based on the use pattern, Long island, are trending. You can trade in both directions.
The figures on the Forex market, the vast majority are not self-sufficient. For decision-making should be guided by signals from other technical analysis indicators.
Before you start trading according to the strategies a trader should clearly understand the following features:
- The highest result can be obtained in the case where the “Island” was formed in the beginning of a new trend;
- The larger the size of the Gap (second), the more aggressive plans you can build;
- If the second gap was completely closed, it is better to refrain from trading;
- If the inside of the island there are smaller Islands, we should expect completion of a trend.
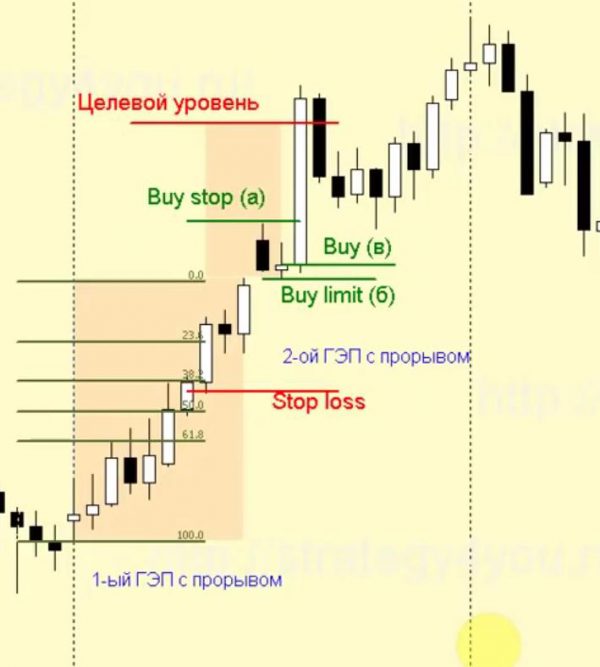
On the “bull market” (the second gap is located above the first) should wait for the formation of the first white candle and put a stop order 10-15 pips above its maximum. You can enter the market at the stage of formation of the dark spark when the market will attempt to close the price gap, but such a strategy seems to me more risky (but gives a greater profit). By selecting this option, you must set a limit order to buy at the maximum value of the candle, which was preceded by a second Gap.

It makes sense to use both types of orders, so to consider the opposite scenarios, but it is necessary to pay special attention to questions of money management.
Forex analysis of the figures allows you to fully plan the deal, so in this strategy to determine the points of stop loss you should use the helper indicators, such as Fibonacci levels. Stop loss is set at the level of 38.2, guided by the Fibonacci grid, stretched between the maximum and minimum price value in the range of the island.
To determine the take profit level will require simple arithmetic calculations. Should determine the height of the island, i.e. the difference between the maximum and minimum price, divided it in half and add the result to the maximum value of “island” prices. This is the take profit level.
For the aggressive fans of scalping the calculated level may be useful as a level at which you can include trailling stop, the depth of which depends solely on the ambitions of the trader. And in a situation of domination on the market bearish trends of all of these operations are performed in reverse.