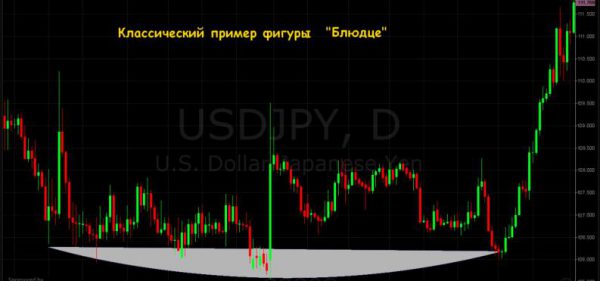
Round patterns the Forex are among the popular tools of graphical analysis. More typical forthe stock market, these figures have been adapted for medium-term trading on the Forex market by William O’neil, a successful currency trader, who recommended this indicator for medium-term trading (D1, W1).

In highly volatile currency pairs Saucer can be formed on the H4, but more stable results the figure shows, starting with the daily charts.
Figure Saucer on Forex: formation
Theoretical background for formation of this shape on the chart can be summarized as follows: for the long-term trend inevitably situations where the interest in trading the instrument is reduced and many traders, reaching goals, closed position. This is a classic background for the correction.
But since. we are talking about a long term trend, the correction of all signs is reminiscent of a turn. But emerging from the technical point of view, the reversal is not getting real support from the traders and the situation is slowly recovering.

Pereslavskii correction traders rebuild their trading position in the same direction and the market continues to move in the same direction. The potential trend increases, because the adjustment process was “swept away” the position of the supporters of its change.
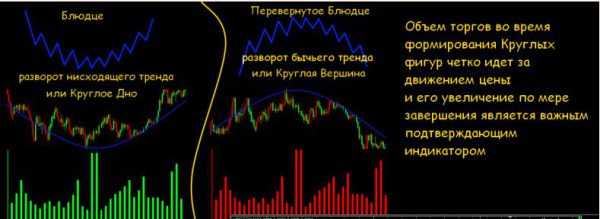
An important indicator, which is an indicator for this shape is the volume of trades. At the stage of formation of the left rim of the saucer, the trading volume will steadily decrease until, until you begin to form the “bottom”. In the process of forming the bottom of the market is unstable – possible abrupt changes in both price and volume. At the end of this stage, begins the formation of the right side of the “saucer”, in which trading volumes are constantly growing, reaching a maximum value at the time of overcoming the resistance level.
Pattern Saucer on Forex can have several varieties, the variability of which depends on many factors, the main of which are the duration of the time-frame and volatility trading tool

But whatever appearance not bought this figure – it is a powerful signal about the turn of the trend.
Model “Saucer”: the features of the trade
Forex trading using round figures – an occupation for very patient traders. The accuracy of the trading signals generated by these patterns depends on the duration of the time interval, which is used in the analysis.
The key level for this shape is the so-called “neck” – a strong level of support/resistance, the breaking of which is a powerful trading signal.
After overcoming this level, events can develop in one of two scenarios refers to determining the point of entry into the market:
- Aggressive. The entrance to the market is in manual mode at the first crossing “the neck” the chart. The method is fraught with danger – a false breakout. Although the vast majority of cases, the timing, even with the “rollback” from the level of the “neck” at least once to test it, that will allow to close the position with minimal losses;
- Conservative. A method for cautious traders. Open position only after retesting key level.
If the levels of open positions more or less clear, with levels of exit from the market is a little more complicated. For these purposes, the key factor is “depth” saucers, the precise definition of which is associated with considerable difficulties. The main reason for these difficulties is “uneven bottom” of the saucer. It depends on the chosen trading instrument – the higher the volatility, the greater the “roughness” of the bottom.
The bottom of the saucer is a powerful resistance level. At this level, you must set a stop loss. For these purposes, it is recommended to use the extremes of the graph, but the variation in the price indices for the bottom line can be so significant that a stop-loss on this line would be invalid from the point of view of money management strategies. Here to make specific recommendations difficult and all depends on the financial capabilities and ambitions of the trader. Take profit is set at not less than one-third of the distance traveled the previous trend.
The rest of the figure Saucer pattern is quite effective and allows you to enter the market with minimal risk of loss. The main thing is to understand the details and prevent serious errors.