
Many of the figures Forex actually apply equally when observed trend is ascending and descending. However, there are exceptions that work out well only in one case. A vivid example – the pattern of a “dead cat Bounce”, on which the trade is conducted only in a bear market.

Model description
The application of this candle patterns Forex based on such a well-known phenomenon of gap in Forex. This concept means a strong price gap when a new candle opens significantly higher or lower than the closing level of the previous one.
Dead cat bounce occurs when the securities market (shares of companies) has developed a downtrend. At the same time develops several conditions:
- At some point the asset does gap down.
- The difference between the two candles that formed the jerk, should be at least 5%. This figure is largely conditional, since it is derived on the basis of numerous observations. However, to comply with a condition is very important because if the gap is very small, the chances of success are dramatically reduced.
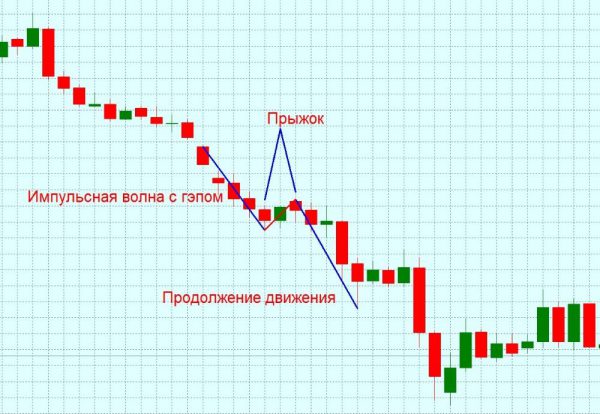
- After the Gap, the trend for some time trying to turn – the cat is like “dying” and makes its final push against the trend.
- Next, the price moves again with the trend, forming a fairly powerful pulse. Applying this aspect of the figure Forex you can take profit.
The figure reflects a pattern of short-term behavior of players in the securities market. When there is a distinct bearish trend and gap formed in accordance with it, while the bulls are trying to regain their positions. It is their attempt to form a dead cat bounce. However, these efforts look very weak, and quickly bears surely lower the price even further.
Important! The strategy applies during the intraday trading. As a rule, the formation of the Gap occurs during the opening of the trading session. Used timeframe – M30.
How to apply the pattern in real trading
The use of shapes in real trading based on simple rules, so novice traders can quickly master the system and get your first profit:
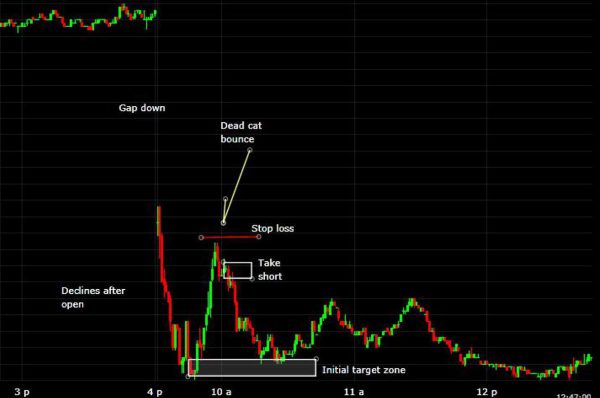
- Stop Loss set at the nearest local maximum, which was formed as a result of dead cat bounce.
- The entrance to the short position occurs at 30-60 minutes, and first profit (Take Short) is fixed during the correction. This refers to the first rebound against the trend after it continued to decline.
- The main goal of (Initial target zone) is determined by the degree to which the asset has reached in the fall (after the Gap). In most cases, the price reaches it, allowing traders take a good profit.
That gives more chances for profit
When a trader will learn to confidently identify the pattern formation on the chart in real time, should learn to analyze the market on the basis of additional tools. For beginners one of the first questions: how to use Fibonacci to obtain the greatest profit based on the correct inputs.
A grid of these lines gives a good understanding of the key levels where the price. On the example of the model it is installed, as shown in the figure below:
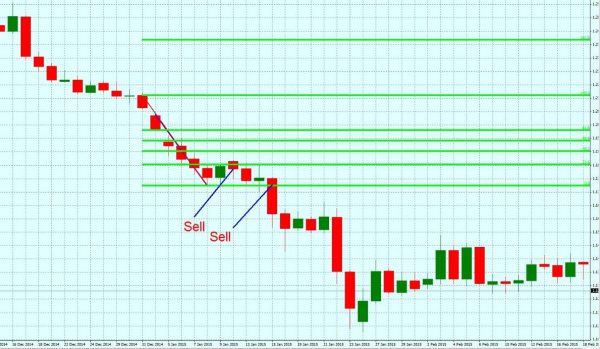
Fibonacci lines extend from the minimum of the correction values to the level of the beginning of the bearish trend
As soon as the asset reaches the level of 61.8 (closest above the line 50,0), you can make inputs on short positions, taking profit at the first correction (short flat).
Along with the Fibonacci Forex trading and the securities market takes into account other important indicators, by which the probability of profit increases significantly:
- The strategy is often used after you have received negative news on the considered asset, with the result that it experiences a significant loss in price.
- If, in addition to the pattern observed other signs of continuing the trend, this increases the chances of a correct prediction. You should pay attention to the performance of technical indicators and other patterns Price Action.
- When, after the dead cat bounce, the price continues to move down from a strong enough trading level, it also gives more confidence to enter.
Considered the pattern very easy to understand. It is important to note that trading on its basis only in the stock market because signals on Forex work is not so good. Strategy could be the first which the beginner will begin to master the market and to fit into an existing trading system an experienced trader.