Analysis of figures on the Forex is one of the methods of the technical approach to forecasting of price behavior. Graphic shapes are very popular, the growth of which is due to the simplicity in their interpretation, and discovery. But, not all models are equally informative and can generate unequivocal signals – their description also raises many questions due to the lack of uniform standards.

Features of the application of the candlestick patterns
And yet, candle patterns in the Forex market can quite effectively be used across the spectrum of trading instruments. As for time periods, candlestick preferred option. Best of all, such models have proven themselves on the daily chart and on the hourly time frames.
However, on long-term charts to apply these candlestick patterns are ineffective because the vast majority of signals are losing their relevance.
Indicators figures on the Forex market, like other technical indicators, vary according to the type of the generated signals. Most of them are related to the category of trend indicators, i.e. candle patterns in the Forex can inform about the turn of the trend or its continuation.
Shape trend in the Forex market, which may seem to predominate in the line patterns, are not the most numerous part of the graphics setups. Although in the literature they are given special attention because it is believed that their signals are more reliable, because false positive rate much lower than the other. But this is not always the case.
Candlestick analysis of the figures on the Forex market includes a graphic pattern with beautiful and eloquent name – Hold on the Mat, which further will be discussed.
Hold on the Mat: features
Such technical patterns Forex, as the Hold on the Mat are a strong signal of trend continuation. On a linear graph its easily confused with the classic flag, which symbolises the continuation of the dominant trend.
He operates equally effectively both bull and bear trend.


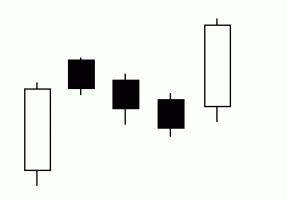
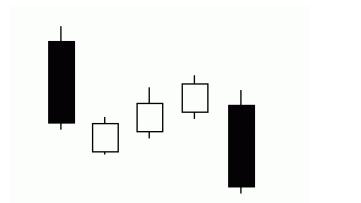
Setup is easy to find on a candlestick chart. Its classic description is as follows: after a long candle in the direction of the existing trend (the existence of pronounced trends is a prerequisite to identify setup) is formed of a short candle in the opposite direction, which can be called signal. Next one candle can be opened with a gap against the trend, but the gap will be closed in the same candle (or its shadow). The third candle completes the set-up short-term correction, demonstrated by the decline against the trend movement.
The closing price of each candle should be above (or below, depending on the direction) than the previous.
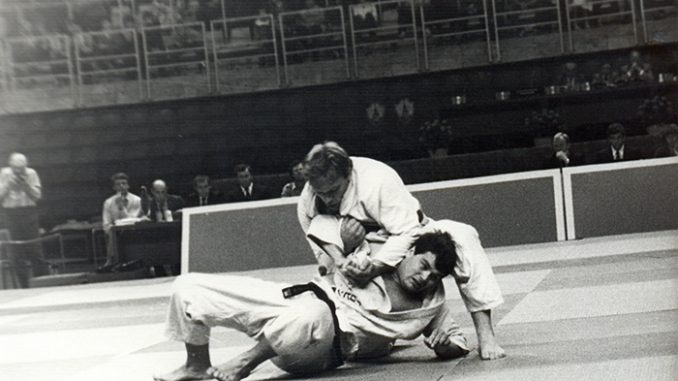
Like many other (almost all) figures of graphical analysis, the pattern of Financial judo (second name) does not has a high degree of self-sufficiency. Its signals require confirmation from other analytical sources. A good confirmation of the reliability of the signal is a significant reduction in trading volume on the third candle of the setup compared to the first candle.
Trading features
Hold on the Mat, in appearance very reminiscent of the Three rises, but it generates more reliable signals and the percentage of false among them is much lower.
But the basic guidelines trading models are identical after formation of the third candle, i.e. complete formation setup, you can open an order towards the resumption of the trend. Stop loss can be set in 5-10 points from the closing price of the last candle.
To install the take profit you can use the information from the oscillators. For example, with this task a good job MACD.