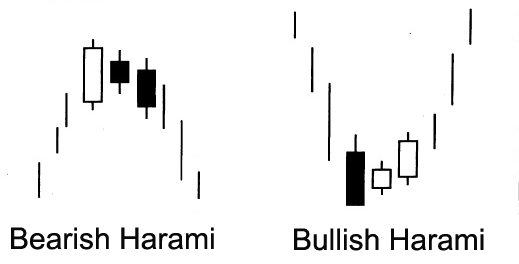
Technical analysis for beginners is the study of the simplest figures of Forex that are easy to see on any chart. Such figures include the Harami Pattern, which in Japanese means “pregnant woman”.

This is an example of the shape of technical analysis, which is often used as an auxiliary model, not the main signal.
How to find the model on the chart
Harami candlestick pattern discover on a graph is very simple. It is formed in a trending market and is a combination of the 2 candles of different sizes and directions.

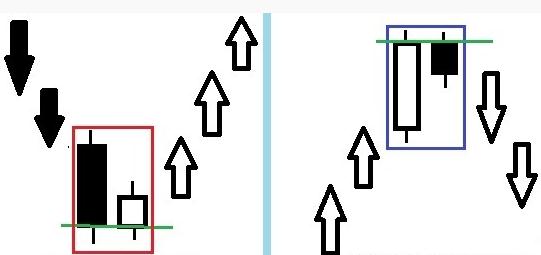
The model serves as a signal for possible trend reversal on bearish (eng. “Bearish engulfing”) or bullish (“Bullish Harami”). The combination can be described as follows:
- Formed a candle with a strong body and slight shadows in the direction of the trend. This candle is called “mother”.
- The second candle is at least 2-3 times smaller than the “mother.” It is opposite in direction, is called “child”.
This is the essence of the pattern. If after the second candle asset begins to confidently move in the opposite direction, so the trend really started to change and it is possible to conclude the relevant transactions.
Figure Harami reflects the mood of the players in the market with a weakening trend. They make one last attempt to lower or raise the maximum price that reflects the candle “the mother.” After that, a “child”, which shows a lack of confidence of traders. And when the asset makes striking steps in the direction of the new trend, it becomes obvious that the old trend is no longer valid.
Features of the application figures.
Forex technical analysis distinguishes different types of patterns:
- Continuation and trend reversal.
- The main and auxiliary.
As already mentioned, the Harami is a reversal pattern, however, is not the main pattern. It is used in real trading as an additional signal confirming the change of trend. Often together with him use other methods of technical analysis indicators, support/resistance and patterns of Price Action.
Upon entering the market, it is important to analyze in what place was formed a figure, and how was the asset subsequently. There are several additional factors that increase the chances of success:
- Application on Forex Harami is possible only if the prevailing trend. At the same time, the longer the trend, the more likely the emergence of a reversal signal.
- The assumption of the change of tendency can be built only when the model has already formed, and have the appropriate candle of the opposite direction.
- The more the bodies of these candles, the more confidence that a reversal has actually occurred. It is important to pay attention to the first bar after the pattern has closed significantly above the Harami.
- If Harami is formed near important support or resistance, which has many times been proven an asset history is another reason for the entrance.
- If the candle “child” is formed without a body or with a very small body (doji star) – this greatly increases the chances of success.
- Skillfully combine the use of patterns and technical indicators is a very important skill for traders. For example, if the graph along with the formation Harami there is growth – it gives much more reason for the transaction.
- Finally, an important and time-frame that is analyzed by the trader. Harami is not usually considered at the time intervals below. In addition, for the daily charts has its own important feature: they spark the “child” is formed not within the “mother” and stands on a par with it as shown in the figure.

How to use the pattern in real trading
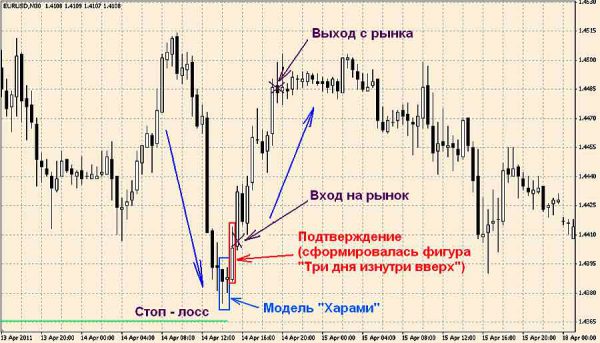
To properly use the signal from the “pregnant woman”, it is important to wait for its formation on the chart and to correctly set a stop loss to know when to exit the market:
- The transaction takes place only after finally engage the first bar after the Harami, which confirms the assumption of a reversal.
- Stop loss is fixed at 4-5 points below the minimum point of the Harami (bullish market above the maximum).
- As for taking profits, then the General rules here – you just need to carefully observe the behavior of the asset, with the emergence of possible signs of a new change of trend. If Harami formed after a powerful, rapidly falling prices, we should expect that the players will play their positions on almost the same difference as shown in the graph.

The skillful combination of model Harami with other indicators pivot allows the trader to see the emergence of a trend at the very beginning to maximize profit.