The Spring pattern is a figure of the Forex market relating to strategies Price Action and consisting of many candles that are generally the assumption of a trend change.

Many technical figures Forex are a combination of several candles, which should be considered as a signal and visualize them with the naked eye.
How to find the pattern on the chart
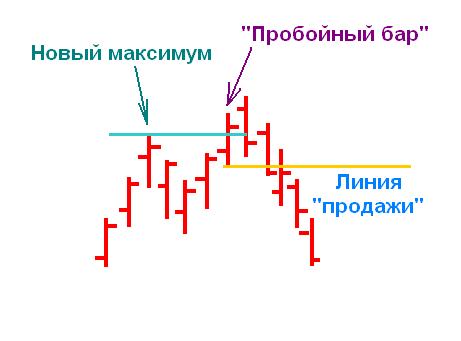
The spring is formed only in a trending market and consists of two price impulses in the direction of the current trend. For example, in a bull market it looks like this:

Pattern can be described as follows:
- Price goes up on the trend and is fixed at a new high, which looks like 1-2 candles upstart.
- The asset will then be adjusted by no more than half of the magnitude of the impulse.
- After that, the price again breaks up and draws another maximum. This level is even higher.
- The asset will then confidently turns around and starts moving in the opposite direction.
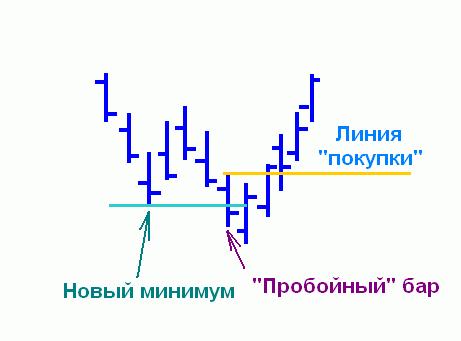
For a bear market description of the pattern will be mirrored:

Spring visually resembles a figure Double bottom/Double top. However, unlike them, in this case, the price makes bounces are not from the same level, but different: subsequent minimum/maximum below/above the previous one. However, these figures of technical analysis Forex have the same value: they predict the trend change.
Pattern Spring reflects the mood of the players during the trends that is on the stage of completion. The trend begins to noticeably lose its strength and the market makes a last attempt to hold the position. So be the first and then second bursts. The asset will then starts to confidently play the position and unfolds, forming a large candle. Often they go one after another, in the form of steps.
When to enter the market more confidently
Forex analysis of the figures lets not only to confidently identify them on the chart, but also to identify the factors that enhance the effect of the signal. In the case of pattern Spring additional signals are as follows:
- The spring can be seen on any timeframe however best of all it works on timeframe H4 and above.
- The longer a trend is, the more likely it is emergency change to the opposite.
- If a reversal candle candlesticks in Forex are formed with large bodies and small shadows is a confirmed reversal signal.
- If the model is formed near a strong support or resistance, this greatly increases the probability of change of trend.
- Spring is good to use in cases where in the near future no major economic news. On expectations of the asset may fluctuate dramatically in different directions, and many models of Price Action give false signals for the transaction.
Finally, the graphic shapes are often applied Forex with technical analysis indicators. In the case of Spring it is important to use the indicators, turn the volume and other tools, with which the forecast can be given with more confidence.
Trading strategy on the basis of the Pattern of the Spring
Pattern Spring can be applied as a separate element of a trading strategy or in combination with the figures of Price Action and technical indicators.
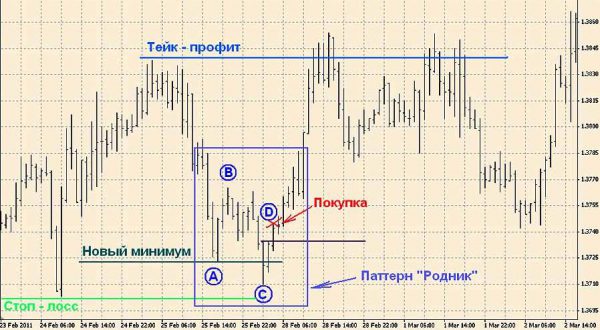
To be able to make a profit, it is important to enter the market at the right time, and to be able to get out of it and put stop loss. In the case of waiting for the change of bearish trend to bullish trade rules:
- Right to enter the market – then wait for when the price makes two consecutive lows (A and C), and then 1-2 the next bar will close higher and strikes both level (point D). To make a deal, you can after a bar broke through the line of at least A.
- Stop loss is fixed at the lowest price value line S.
- Profit is captured when the price was at least the same distance which has been made from the beginning to the end of the old trend.

The Spring pattern is formed on various charts quite often, and it is easy to determine visually. This is a great option for beginning traders making their first steps in trading. At large intervals (over time) the shape is formed much slower, but the result justifies itself – the profit you can make much more than on smaller frames.