
A combination of Japanese candlesticks clearly and, most importantly, to determine the trend as upward and downward. There are also candlesticks that are formed on the chart, in periods of anarchy, i.e., when “the bulls can’t and bears do not want.” It is to such patterns apply candlestick pattern spinning Top.

Japanese candlesticks in Forex as a tool of graphic analysis used by traders very popular. Identifying a trend on Forex, just like any other stock market, is a priority of the investor or the speculator, and analyzing candlesticks allows her to solve successfully. Methods of trend detection are varied and demonstrate different efficiency.
Model Gyroscope: the appearance and nature of formation
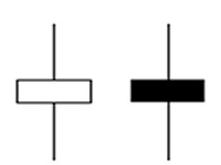
Figure the Top is easily recognizable – it’s a candle with a long shadow and short body. The candle color does not matter – the main thing that the shadows were much longer than the body. It reflects the difference between the opening price and closing price, and the endpoints of the shadows reflect the walls of the corridor, which was the price of the trading instrument during the analyzed period. Therefore, the message that carries the attentive observers this figure is interpreted very simply – there is a fight of bulls with the bears, but the forces of the opposing sides is approximately equal to
All traders know that candlestick chart analysis which allows, for example, to identify an uptrend (as well as downward) consist of several candles. But, at times, to inspect the mainstream of a single candle.
But we should warn the gullible novices in the Forex market is to consider the spinning Top as an indicator to determine a trend, or rather, lack thereof, it would be too presumptuous. The top, as the main part of the graphical analysis figures, it is risky to treat as the only tool of analysis of market situation. To build a profitable trading system based solely on the figures of graphical analysis, it is impossible. In any case, the history of such examples unknown.
Trade model Gyroscope
The Top model in the slightest degree does not violate the above rules. The more that the figure is formed on the chart during periods of uncertainty, i.e. the lateral movement of the prices. A similar situation experienced traders prefer to wait on the sidelines.
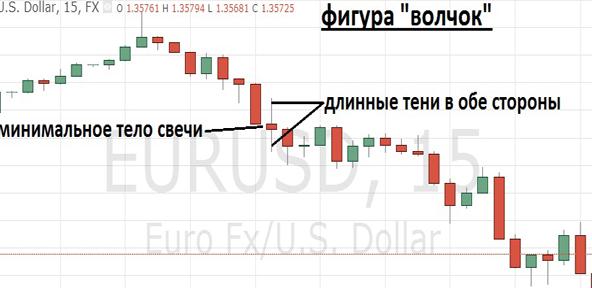
Figure spinning Top symbolizes the lack of clear trends in the market, but at its basis it is impossible to draw conclusions on the further development of the situation – the sideways movement is equally likely to be a short-term correction or a harbinger of a trend reversal.
It would be possible to recommend the Top as a limiter of the corridor for trading on the rebound from the support levels and resistance, but such leapfrog can please the soul only the “inveterate” scalpers.
The results
Japanese candlesticks as a graphical model, it is highly controversial but, nevertheless, their popularity as a technical analysis tools is very high. A trader, especially a beginner, should understand clearly that all figures of graphical analysis, but rather the signals that they generate, require confirmation.
In fact, they are designed to draw the attention of the trader on the market of a trading instrument. But detailed analysis and, especially, to predict future developments requires different analytical tools.
Learn about Japanese candlesticks from the video: