Pattern 1 2 3 is one of the most famous and the most popular among traders in the Forex market graphic patterns. Such a high interest in the environment of currency exchange traders pattern 1 2 3 earned in its simplicity, recognizability and accuracy (and timeliness) of the generated signals.

Although in fairness it should be noted that the last two characteristics, namely accuracy and timeliness, largely dependent on the correct settings, in particular, from the time period.
Model description
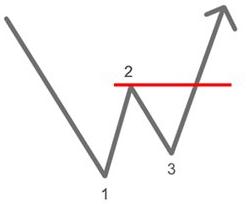
1.2.3 pattern is a turning figure, warning of a possible imminent reversal of the trend. Externally, it looks like Latin W.

This figure is formed in three stages:
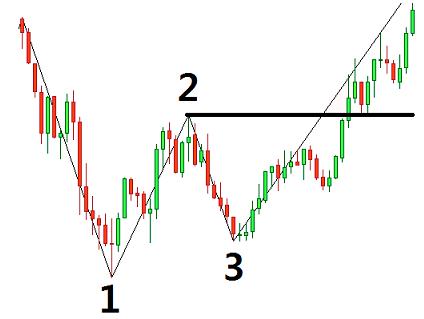
- The momentum in the direction of existing trend (point 1);
- Correction (point 2);
- Repeated attempt to pass the resistance level, which also ends inconclusively (point 3.
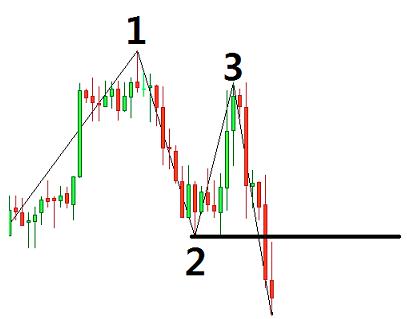
On candlestick chart, the figure might be as follows:


For a more precise definition of the shape on a graph using the indicator 1 2 3. The pattern has long been known to traders, so this indicator is included in the basic package of many trading platforms. Even if the platform does not have this indicator, you can easily download any specialized information resource. Installation and setup of the indicator is very simple and will cause difficulties even for a beginner.
Trading features
Most figures of graphical analysis, especially those that are called rotary, are self-contained, i.e. not require additional evidence for decision-making. By and large such allegations are true, but still trading system, based solely on signals of one shape to suffer some deficiency – they allow the trader to extract the maximum profit from a specific market situation. Graphic shapes well determine the direction of the trend to identify its potential and momentum they are unable to.
Therefore, experienced currency traders use proven graphic shapes in conjunction with reliable oscillators. In the descriptions of patterns most authors try to stick to the careful wording that looks like ” … reports that there is a possibility of turning the trend.”To significantly increase this probability should be closely monitored chart trading tool on sites close to the pattern.
So if the first pulse pattern 1.2.3. was preceded by a candle with a short body (body color is not important) and long shadows on both sides, even after the completion of the third pulse to make a big deal with far-reaching goals you should not. After all, almost certainly the market has not yet formed a clear mood, and the trader has to deal with lateral movement, the volatility of which will be reduced, forming a pennant, which, as you know, the figure does not swivel.
Conversely, if the first pulse is preceded by a candle with a short body and long shadow in the direction of the old trend, the previously mentioned probability is very high.
Pattern 1 2 3: description of the strategy
All the trading strategy based on this pattern is simple and even primitive, but still effective enough. On the basis of this figure has developed an effective strategy 1 2 3. The pattern is fairly well recognized on the chart and does not require complex actions. The algorithm for the nascent bullish trend the following:
- To wait for the formation of all 3 points according to the description of the pattern;
- Set stop buy order at +3-5 pips above the point 2 (taking into account the broker spread);
- A stop loss is set at -10 points from point 2.
- The most difficult is the case with the calculation of take profit. In a classic description of the strategy contains the following recommendation: “the Take profit is calculated as the distance from point 1 to point 2, and is delayed from point level 2 in the direction of a new trend.” But we can safely say that after the formation of point 3, the market inevitably goes beyond the level of point 1. This behavior guarantees a profit, but to plan a transaction from beginning to end and generate the maximum profit, you need to enlist the help of a reliable oscillator.
For “bearish” trend is all to do Vice versa.
Many of the strategies constructed on the basis of the pattern signals comprise oscillators. Often it is the well-known Stochastic or RSI.