The pattern of Absorption and Price Action recently reached its peak. But it is necessary to consider the prospects and dangers that carry these graphic figures Forex.

I would like to draw attention to the fact that the figures of Price Action and pattern of the Absorption of a few struggling for the definition of the classical graphical shapes, according to which this category of analytical tools include models with predictable development. In terms of the predictability of development, these figures can be called indicators with very significant reservations.
The pattern of Absorption as an indicator
Setup refers to the category of rotary.

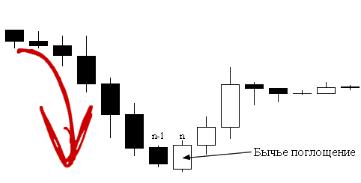
As with all candle patterns Forex this category, it is a lost potential trend and is intended to signal a turning market. As the figure shows graphic interpretation of the pattern is very simple – the signal candle must completely cover with his body the body of the previous candle and have a different color.
At first glance, everything is simple and clear, but in real life everything is much more complicated and the main problem lies in the fact that the absorption in a pure form is extremely rare. As a rule, the formation of this pattern is the result of a powerful Gap, which rarely happen during the trading week. But the breaks that occur after the weekend, in most cases, generate false trading signals.

In addition, the Gaps of the day, which are observed in the Asian session Monday, generally close to European trading platforms, but to call this situation absorption there is no reason. Thus, figures on the chart Forex formed in such a situation, and looks very reminiscent of the classic acquisition does not carry any meaning and cannot be used as a graphical indicator.
But despite these factors, the pattern of Absorption is used by traders in the Forex market as a standalone indicator.
Trading strategy Absorption
Before you will be considered a trading strategy based on pattern Acquisition, I would like to draw attention to a number of factors that can enhance the reliability of this pattern. Among them are the following:
- Body control candles more than two times larger than the body of the previous candle. The figure will be even more reliable if the test candle engulf your body 2-3 previous candles;
- The shape is on the background of the significantly increased trading volume on this trading tool.

Trading strategy is quite simple. Its main provisions can be summarized as follows:
- The entrance to the market by using limit orders. Fixing the formation of signaling candles, set the order on the opening level of the candle preceding the signal (i.e., the last candle of the old trend);
- Stop loss is set below (or above) the extremum of the past trend;
- With take profit, the situation is much more complicated. Like all trend (or counter-trend) indicators, this pattern does not allow to assess the potential of emerging trend. Therefore, for the full settlement of the transaction should use a trusted oscillator.
Price Action: strategy
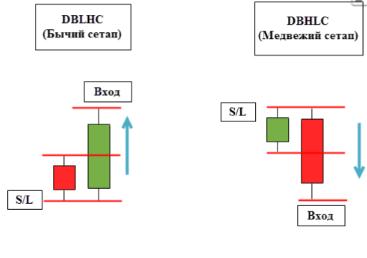
Indicator Price Action can be called a new interpretation of the pattern of Absorption. Rate lance Beggs on Price Action actually describes the features of the use of this figure of the Forex market on a short term basis.

Learning course on Price Action or book lance Beggs involuntarily pay attention to the brilliance of some well-known pattern in his descriptions. Having no reason to doubt the calculations are a successful trader, you should pay attention to one very important detail. Price Action or in other words, the scalping version of the pattern Acquisition, provides for the conclusion of business transactions with a high level of risk such operations carry a large psychological burden for the trader.
Some brokers allow traders to use the indicator is Price Action in automatic mode. But such transactions have little to do with currency trading and more similar to a bet on the bookmaker.