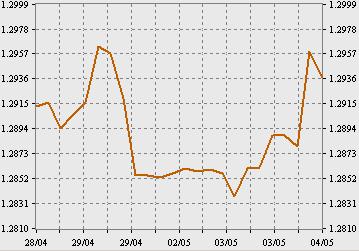
The price chart in the Forex is the main source of all the available “ordinary” trader information. It is a basic tool for all kinds of analysis (except the fundamental). And many fundamental indicators, in one way or another, take into account online chart Forex.

Chart Forex: types
Currency chart for Forex can be of three types:
Linear – chart trading Forex linear type is the most simple and, at the same time, the least informative. Its main drawback is that it is based on the same kind of price shopping tool.
The bar chart and the tick chart is a real chart in Forex, each time period which can be identified on four price indices:
- Open price;
- Close price;
- The minimum price;
- Maximum price.
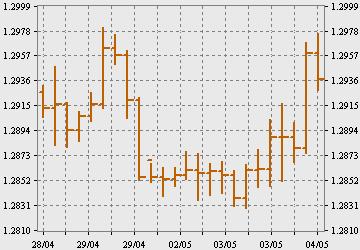
Analysis of bars on the chart Forex allows you to get a more “three-dimensional” picture of the market situation. Tick represents a bar chart, but each individual bar is of the TEC, i.e. the minimum change of the trading instrument. Technical analysis charts Forex based on tick display has no practical application and might be of interest only to “turbo-scalper”
Japanese candlesticks are the most popular type of graph. It is based on the same algorithm as graph bars, but it is more informative due to its clarity. Market analysis Forex chart patterns allows the trader to save time. Programs for the analysis of charts, for the most part, are also being developed for the options with candlestick charts.
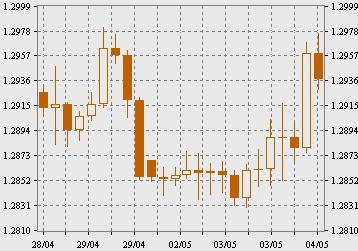
Due to ease of construction and clarity, these types are very popular to all traders, regardless of preference on the part of selection of trading instruments.
Chart analysis on Forex, whose ultimate goal is the adoption of trading decisions must conform to the requirements of efficiency. Candlestick analysis for this criterion is out of the competition. Here it is most convenient to trace graphic patterns, i.e., typical configuration of candles that reflect the model, in one way or another, the price movement of a trading instrument.
The theme of the graphic patterns dedicated to a variety of materials. As analytical tools for many graphic shapes ambiguous, and often contradictory. But many “family”, there are many models that deserve detailed consideration. One of these setups is the pattern Tweezers
Model Tweezer: features and nature of the formation
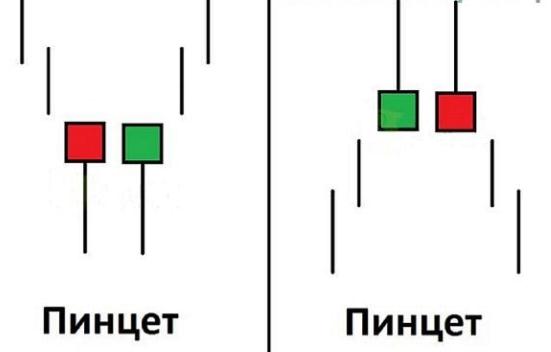
Pattern Tweezers, unlike most shapes of candlestick analysis is a powerful signal. But even he requires additional information. This is a rotary model, the formation of which clearly warns about the turn of the trend. But on its basis it is impossible to draw conclusions about the potential and impetus to the emerging trend. For these purposes, it is advisable to use the tested oscillators.
Description the pattern is simple and does not allow alternative interpretations – two opposite candles with bodies of the same size. The length of the shadow plays a minor role, but the closer in size the length, the more credible setup. Shadow on the other side of the body should be absent.
In special literature two descriptions of this pattern:
- “Tweezer” of the two sequentially molded candles;
- The model with intermediate candles.
The controversy on this issue is not included in the plans of the author of this article, but, nevertheless, it should be understood that the rapid and unambiguous interpretation of the market situation is the main key to successful trading. A figure in which two identical candles of different colors are separated by other candles can be named anything, but it’s not the Tweezers.
Trade with tweezers
As already mentioned, the tweezers is a strong indicator of a trend. A significant amplifier of this signal is the formation of a model after a dynamic and long-lasting trend.
In the process of analyzing the Japanese candlestick patterns traders are often faced with models of transformers, which can serve all without exception patterns. Here we consider a Tweezer starts with a long-Legged Rain shadow, which is directed towards the existing (assumed to be damped) trend. This candle can be (but may not be) as a warning.
Speaking of trading systems built on this pattern, it should be noted that such systems are not. In other words, the pattern and the algorithm of its formation are applied in many systems, but they all use the Tweezers as, though very powerful, but the auxiliary signal.