In trading, there is a group of methods, which defines the conditions for continuing the current market trend. In the graphical analysis, there are many patterns to determine future development trends (the so-called continuation patterns). One of them is the pattern of the pennant.

The ability to see the point of a trend reversal often brings significant profits – after all, the probability that the current dynamics of price movement will continue and will not change. The idea is formulated in a simple rule: “Follow the trend!”.
How to see the pattern on the chart
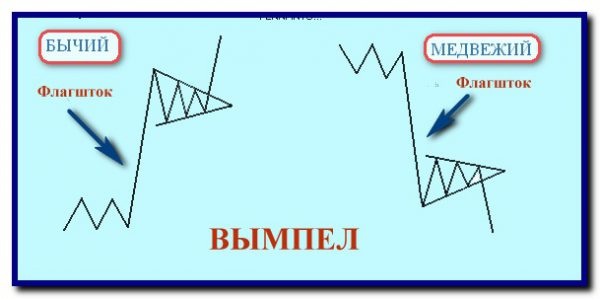
Figure Vympel on Forex, stocks, futures is determined similarly. This is a fairly common model belonging to the classic patterns of Price Action. It is easy to identify on the chart because it really looks like a pennant. Schematic drawing:

The pennant has the following features:
- A strong price impulse (called a flagpole), formed by consecutive (usually speed) candles with large bodies and small shadows.
- Correction, the shape is close to correct or slightly elongated triangle, which you can get, if you draw 2 lines (one on the highest points of correction, the other – for the lowest).
- Further driving the trend immediately after the exit of the triangle (on the penetration of its borders).
The pennant of the Forex market can appear both in the bearish and bullish trend. Accordingly, the description of the models will be mirrored.
Important features of the pattern
Pennant pattern Forex market appear on a chart quite often (several times a day). It is more common in low time frames (from 5 minutes up to M30).
The model is generated very quickly, so keep an eye on it, you need in real time. Moreover, it can have stronger effect if either of the following conditions:
- The original impetus of the price (the flagpole) is formed from a strong level of support or resistance that has already been tested several times. If the level is indicated by the round number (0,500, 0.750 in, etc.) – it makes it stronger.
- The market is very volatile, for example, during the opening of the European session.
- The trend in the direction which formed the pennant, strong and developing for a few days.
- Correction of short duration, and bars that make up the flagpole, have a distinct large body.
Flag and pennant: how not to mix
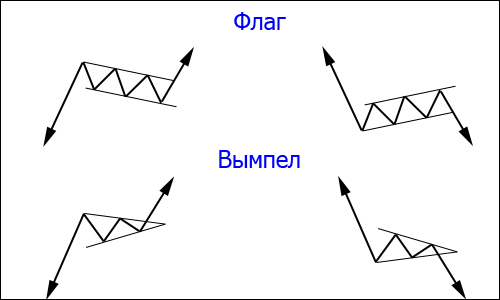
It is intuitively clear that patterns flags and pennants the Forex market are very similar, not only externally, but in essence – they are both patterns of continuation of price movement. However, you need to be able to carry out a clear boundary between them. And to understand the differences is possible by the following features:
- the exterior of the correction of the pennant is always a triangle, elongated horizontally, while the flag has a correction in the form of a parallelogram (the origin of its name);
- the flag is formed at intervals of not less time and for much longer than pennant.

Important! Taking the decision about the entrance, you need to clearly understand what kind of figure of trend continuation was formed. Depends on the optimal position of the exit point, expected rate of movement, and accordingly the take profit.
How does the entry strategy for the pennant
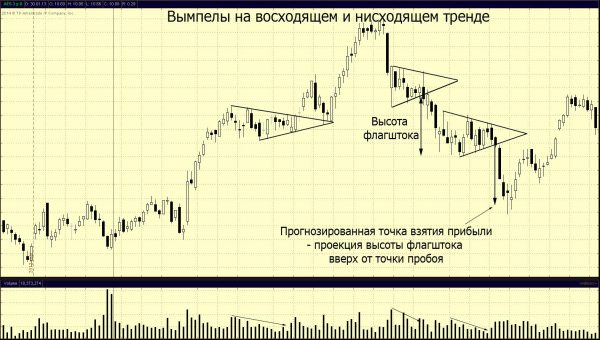
Graph shows patterns pennant:

What rules you want to apply the strategy:
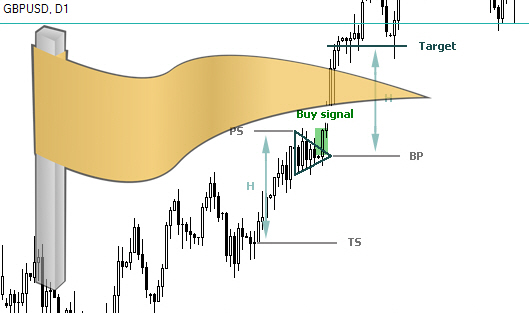
- The entrance is always not before the pennant is fully formed and the price will begin to emerge from the correction powerful candles that match the trend.
- Stop-loss is set for the maximum level, which the price reached in the triangle on a downward trend and minimum in a bullish trend.
- Profit is projected according to the size of the flagpole is about the same distance the price needs to go at the exit of the correction. There and put take profit.
The results
Like many other figures, the pattern of the pennant well fulfills in the period Mednovosti trade. It is not recommended to rely on it if the market is waiting for important news release. At this time, the price may be very worn either side, so the pennant will give many false signals.